Searching and Filtering
To view a how-to tutorial on searching and filtering, check out this video here:
Searching
SnapAttack serves as a living repository of intelligence, threats, detections, and attack scripts. Being able to search and filter can help you find the right content, and even answer complex questions. You can get to the search page as a drilldown from either the dashboard or the ATT&CK Matrix, from the navbar by using the search field or clicking:
- "Research" → "ATT&CK Techniques", "Threat Actors", "Software", "Vulnerabilities", "Intelligence" or "Collections"
- "Detect" → "Detection Library" = "Validate" → "Attack Script Library"
- "Sandbox → "Threat Library"
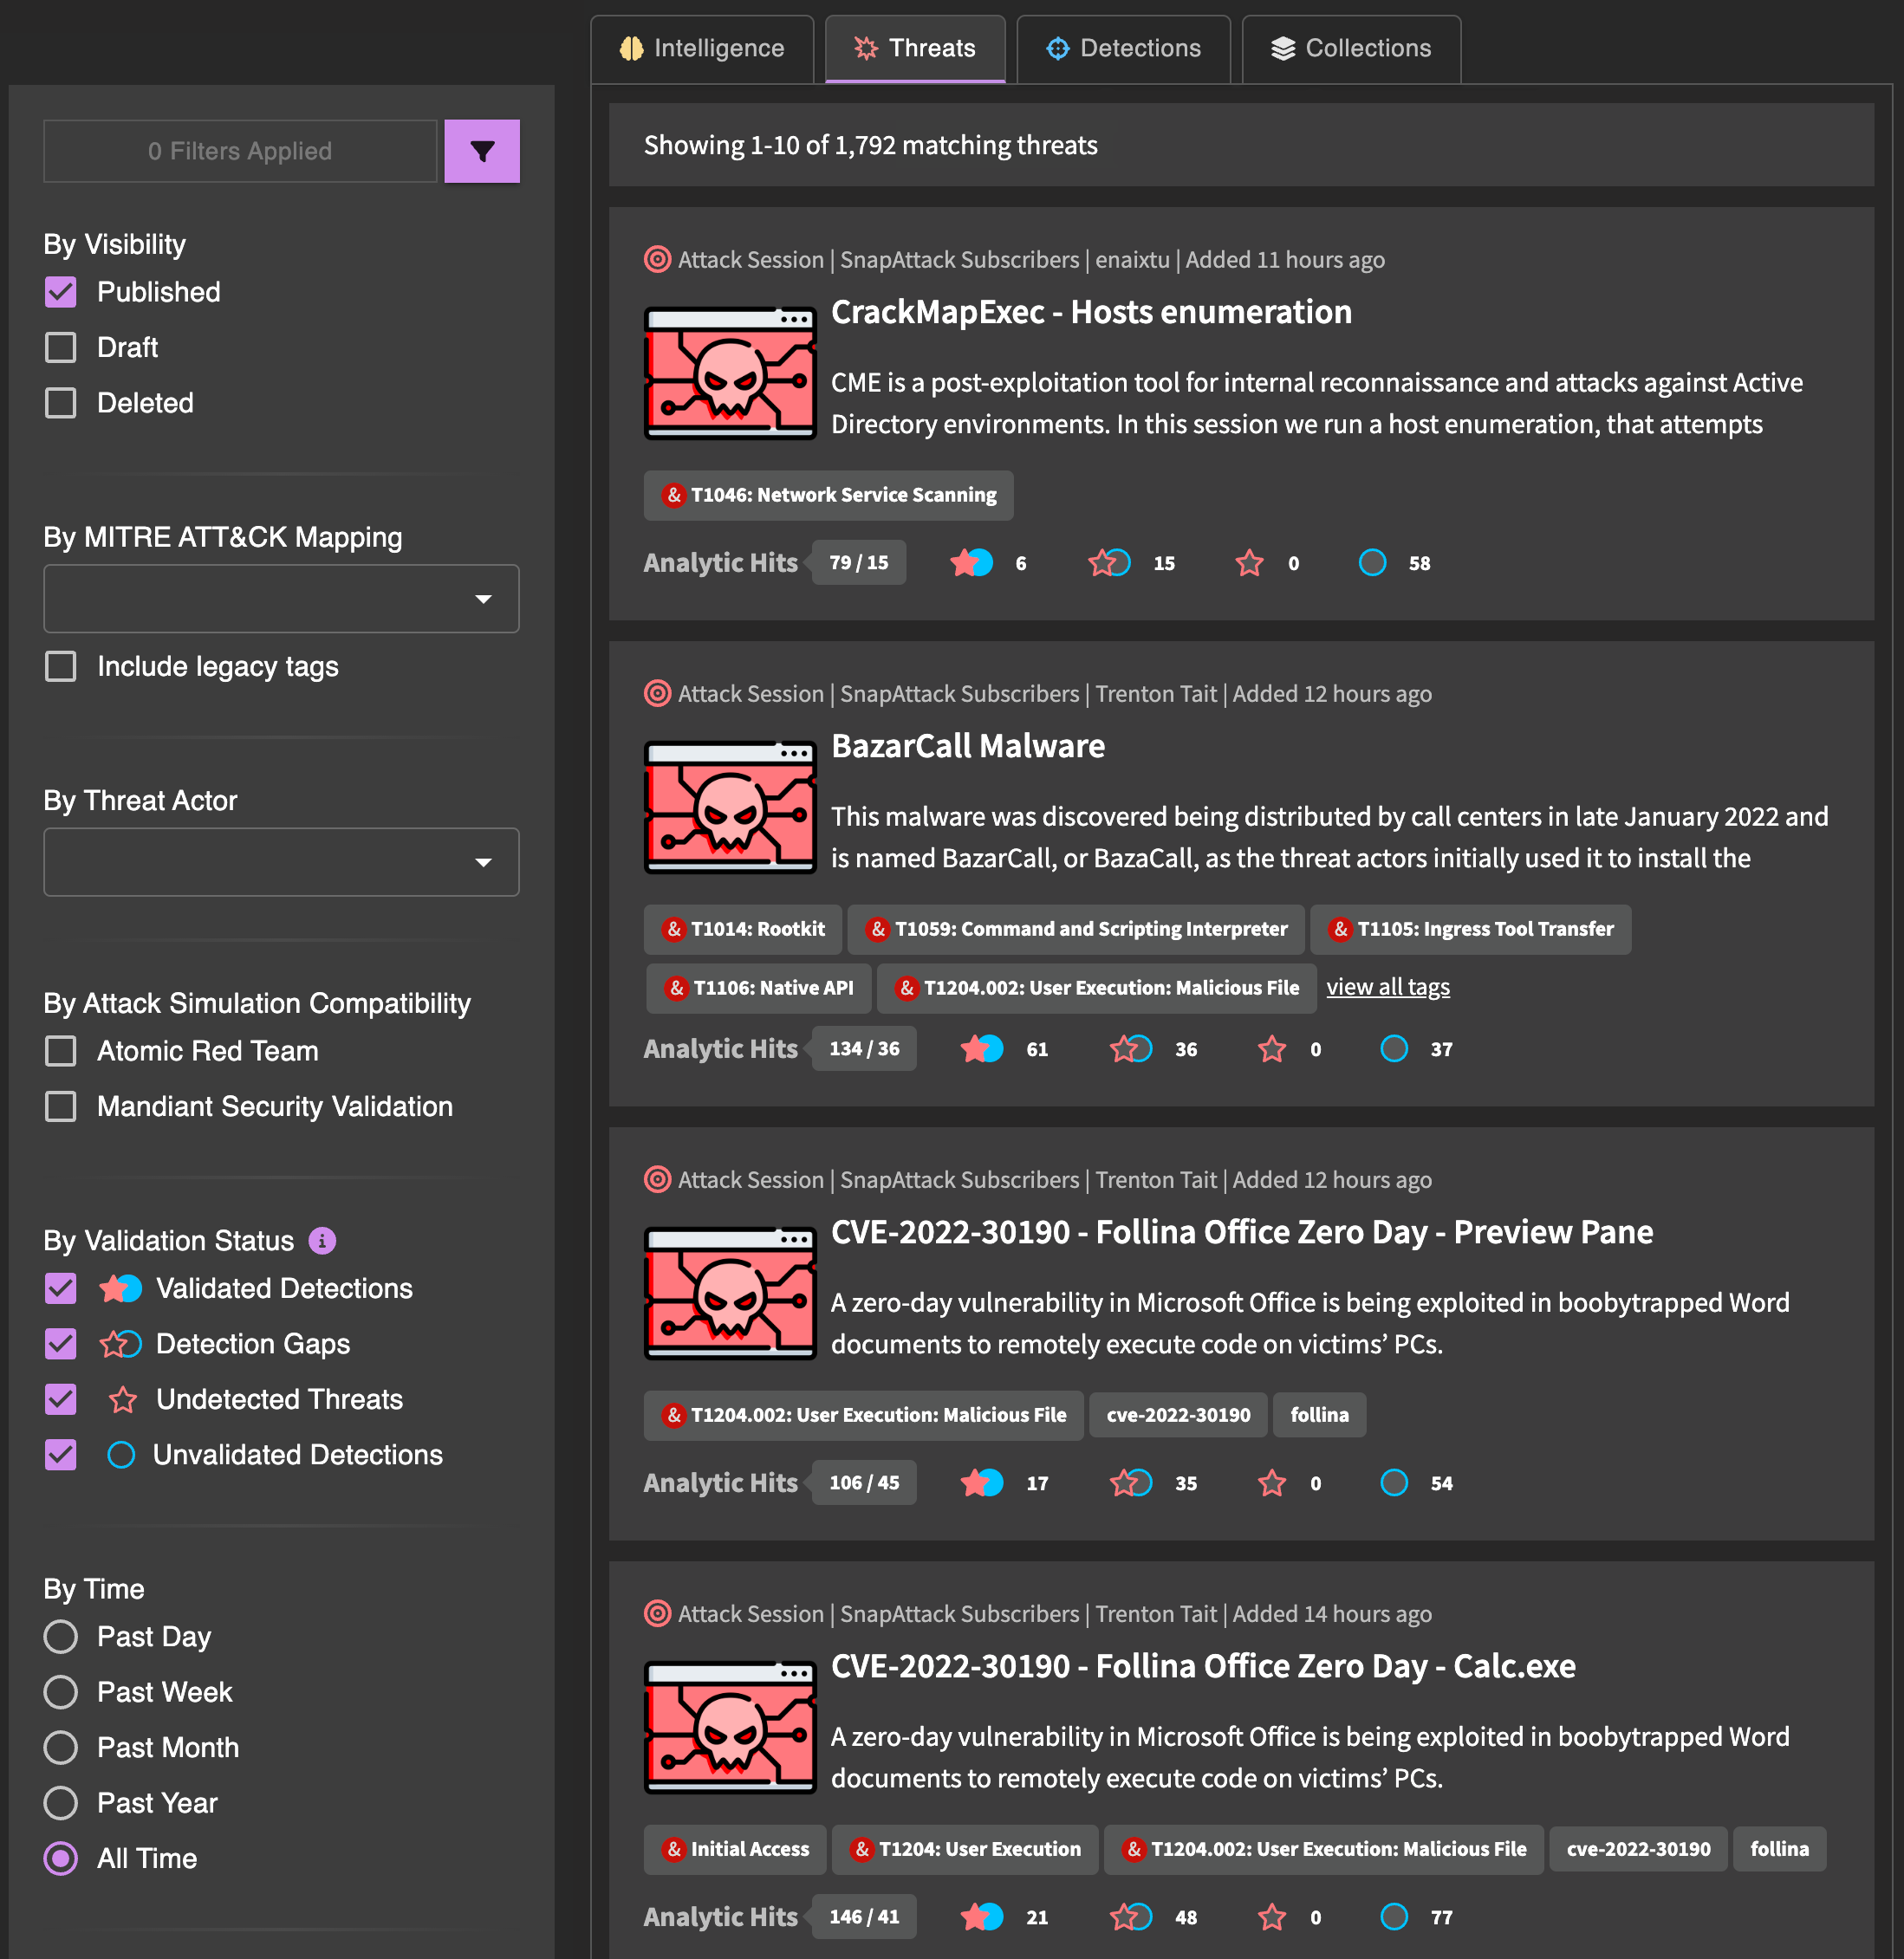
Search results are split into tabs based on content types, which are  intelligence,
  threats, and
  detections.
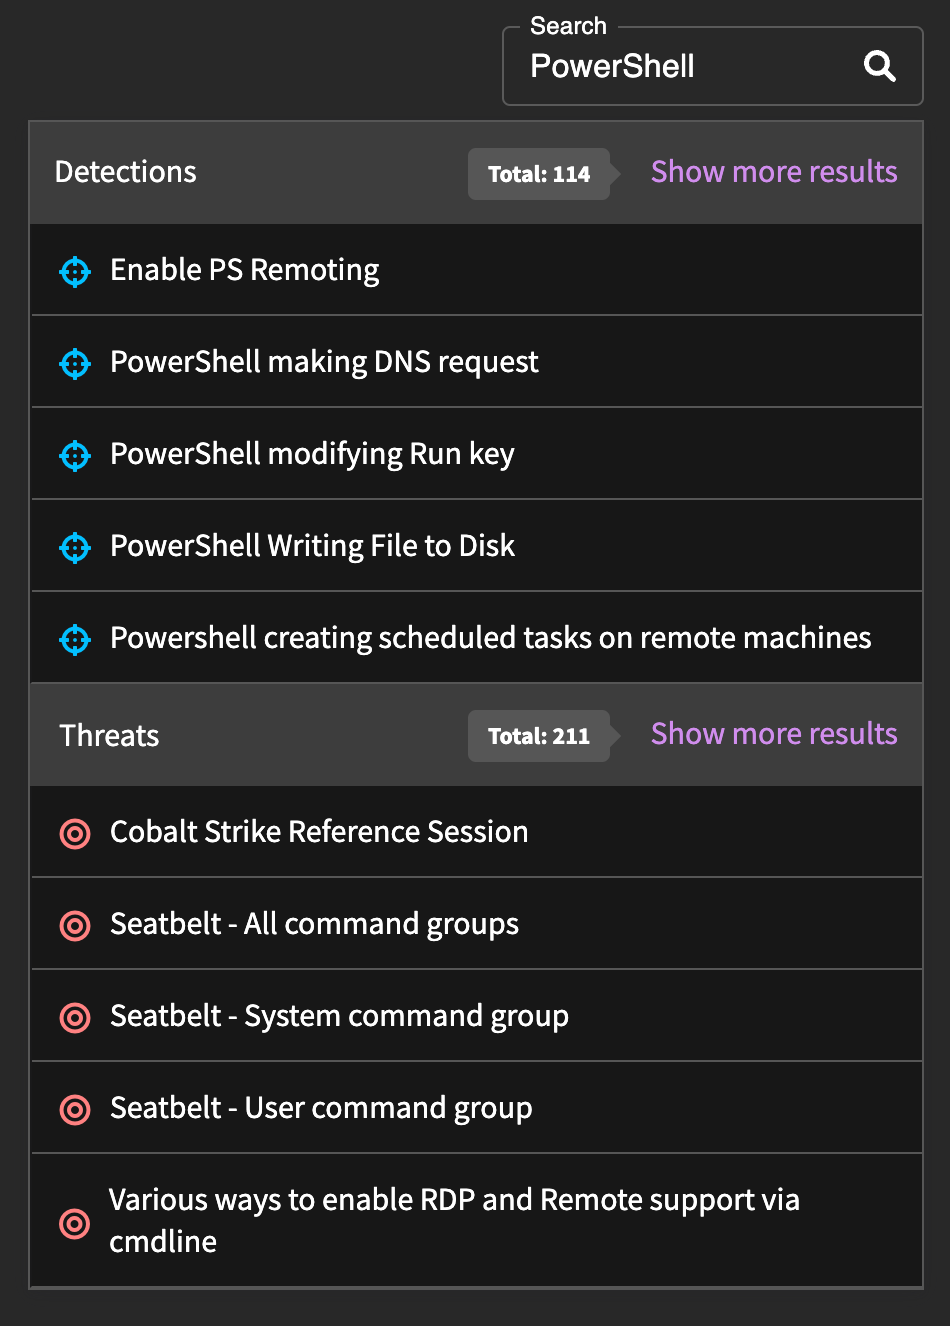
You can perform a full-text search of titles, descriptions, and detection logic (only for detections) using the search field in the header from any page, and it will preview content that matches the search. If you are already on the search page, it will apply the search and display the results directly on the page. Searches that include a full-text search are ordered by relevancy instead of the displaying the most recent content first.
Advanced Search
You can create advanced search queries based on the Elastic Query DSL and enter them into the search box. The search box will automatically determine if you are performing a basic search or advanced search. Below are some of the fields that you can search for:
Common Fields:
- name: searches only the content name/title (e.g.,
name:"Cobalt Strike"would return content with "Cobalt Strike" in the title) - description: searches only the content description (e.g.,
description:psexecwould return content where "psexec" is included in the description)
Additional Fields for Detections:
- author: searches for the original author (e.g.,
author:haagwill return detections created by Michael Haag) - logsource: searches the logsource (e.g.,
logsource:process_creationwill return EDR process creation detections) - raw: searches the raw detection logic (e.g.,
raw:scrobj.dllwill return detections for Squiblydoo)
Additional Fields for Intelligence:
- url_token: searches the reference URL (e.g.,
url_token:blog.talosintelligence.comwill return intelligence from the Cisco Talos blog)
You can also use logic to construct advanced queries. For example, (raw:wscript.exe OR raw:cscript.exe) AND logsource:process_creation would look for EDR process creation detections that look for wscript or cscript usage.
How to Read Results
The feed page displays content in the platform that matches the applied search and filter criteria, and gives a summary of the content. You can click on the card to navigate to the content item's page.
The content cards have a similar look and feel, but there are some differences depending on the content types.
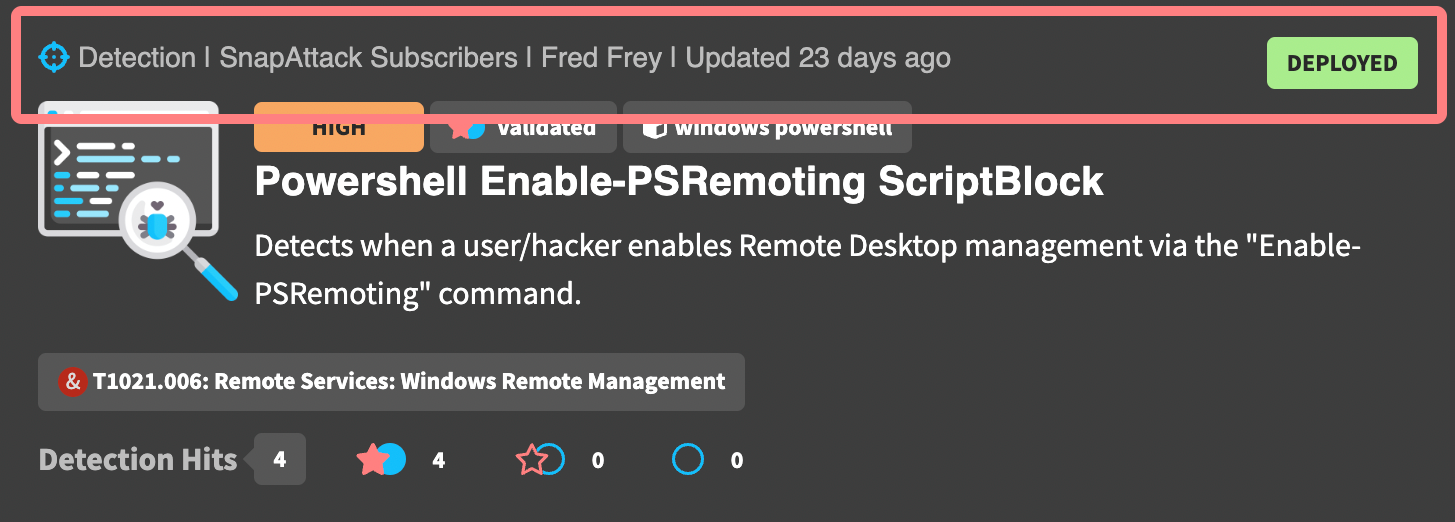
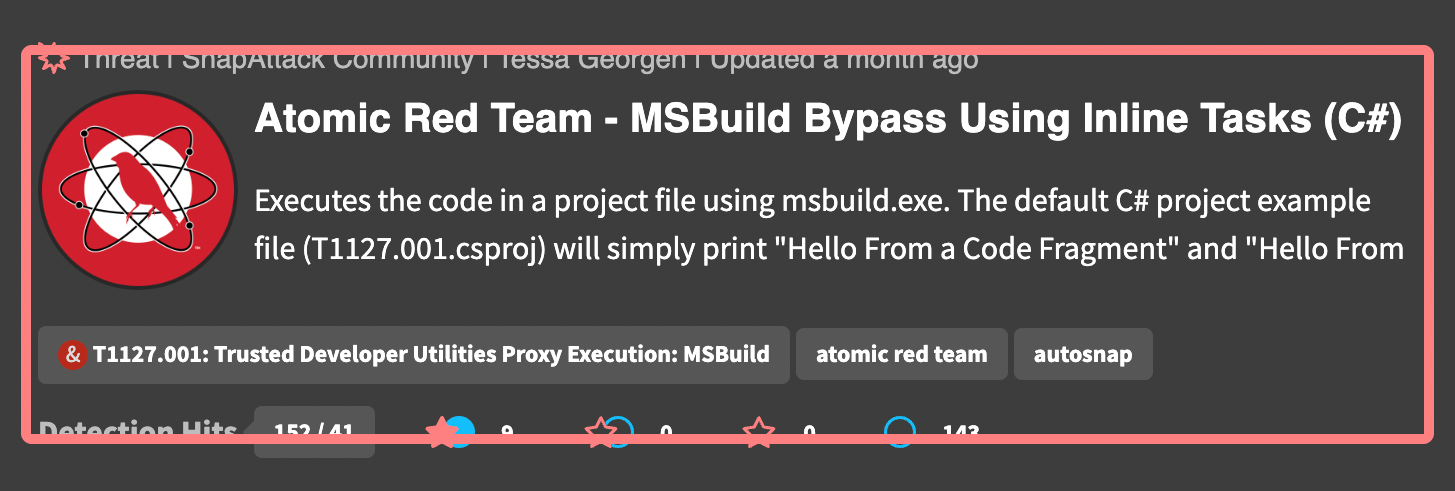
The top of every card contains the content type, owning organization, original author, and last updated date. This row may also have badges that appear off to the right if the content is in a draft visibility state, or if the detection has a workflow state applied.
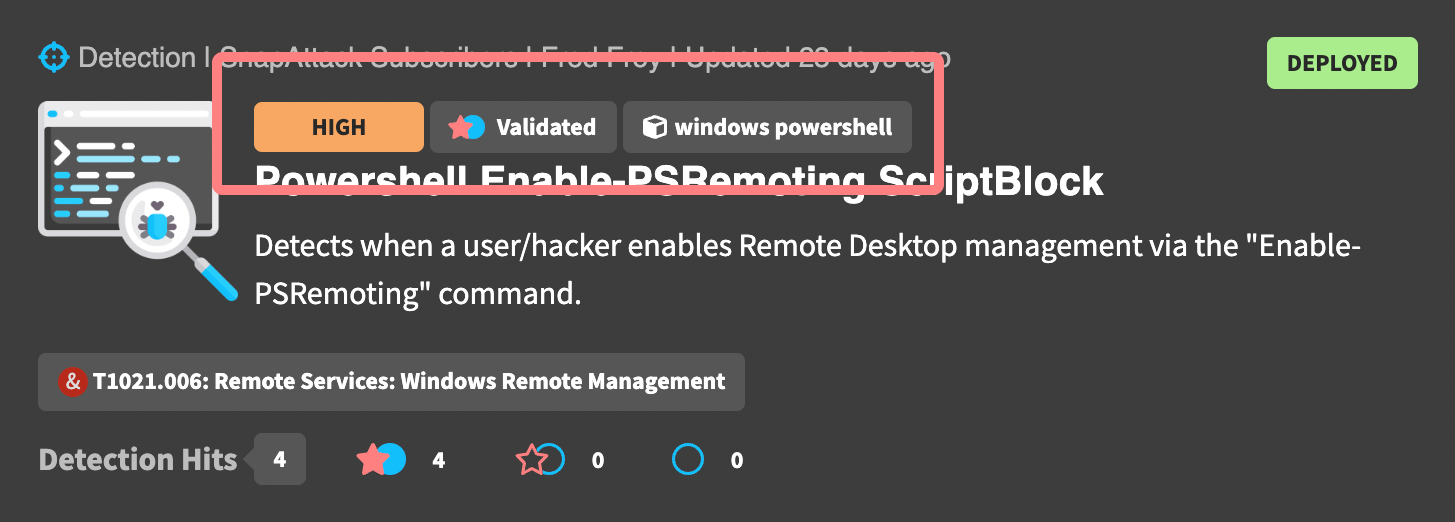
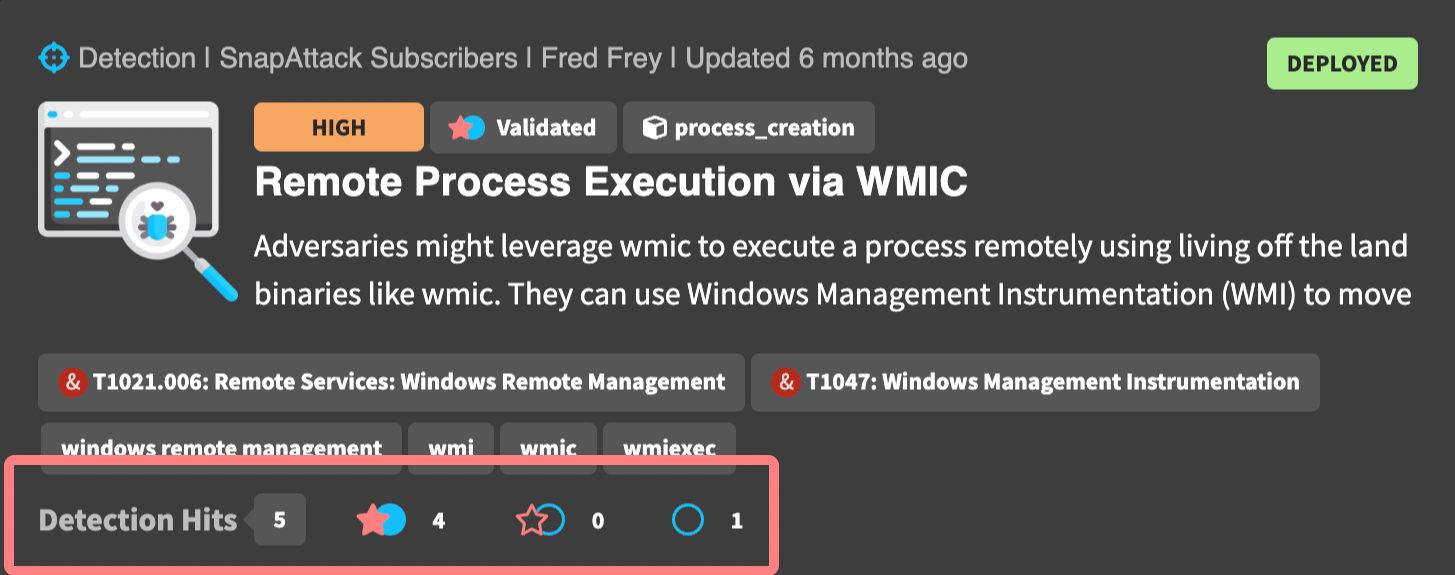
Detections have a few additional badges above the title to help describe the content. These include the detection confidence, the validation status, and the log source. For the example below, we can quickly see that this detection has a high confidence, has been validated against one or more threats in the platform, and uses the Windows PowerShell event type.
The body of every card has the content's title, abbreviated description, and applied ATT&CK and regular tags. Content items will also have an image which could be from the source, the community/project it belongs to, or the owning organization.
The bottom of the card will vary depending on the content type.
For intelligence, this includes the number of linked or referenced content items, as well as the counts of each linked content type. For this example, we can see that there are 1 linked intelligence objects, 6 linked threats, and 4 linked detections.
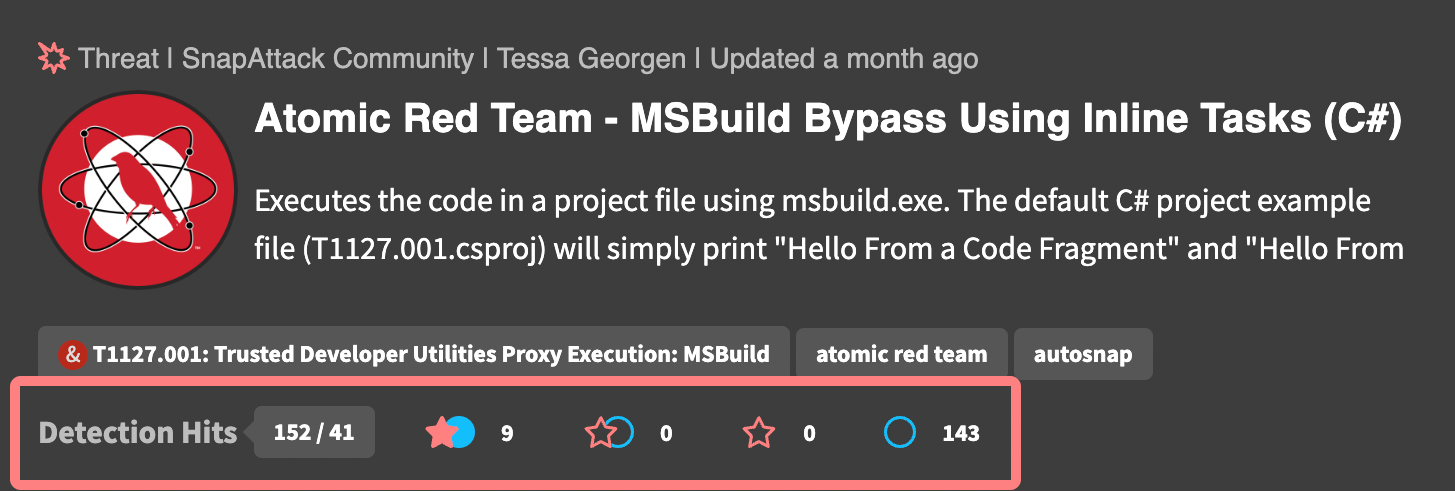
For threats, we can see the detection hits and their validation statuses. In this example, we can see that there are 152 detection hits (41 of which are unique), and of those hits, 9 have been validated, 0 are considered detection gaps, and 143 are undetected. There are also 0 undetected threats &mdash labeled attacks that do not have a nearby detection hit.
For detections, we can see how it's performing in the platform. In this example, we can see that this detection has hit 5 times across all threats in the library, and we can see that 4 of those hits have been validated, 0 are considered detection gaps, and 1 is undetected. Untested detections — those that have never hit on a threat in the library — will not have this row.
Filtering
Filters help refine your search to display more relevant content. You can ask very complex questions, such as:
How many detections do I have that are related to PowerShell?
That are tagged with Red Canary's Atomic Red Team and I can replicate in my environment?
That are compatible with my EDR, CrowdStrike?
That alert at a highest or high confidence?
And that have been validated against a true positive attack?
As you can see, searching and filtering provides many options to help you quickly find the content and answers that you need.
Additional details on the filterable options can be seen below.
By Visibility
Content has different visibility as it moves through the application. All content starts as a draft, which is only visible to the author and organization administrators. When the content is ready to share, the author can publish it. Published content is live in the system, and is the default search type.
By MITRE ATT&CK Mapping
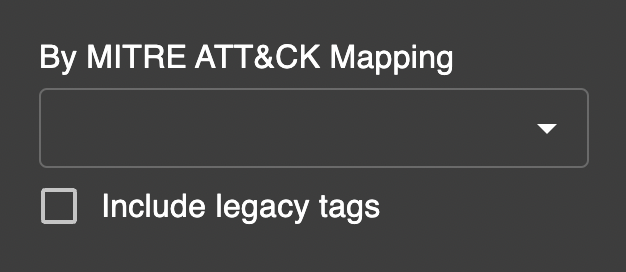
All content in the platform is tagged with MITRE ATT&CK tactics, techniques, or sub-techniques. You can search and filter content that has one or more ATT&CK tags. By default, we search only for active ATT&CK tags. MITRE has a process for deprecating and revoking tags, which may be applied to old content. For example, T1086: PowerShell has been deprecated in favor of T1053.001: Command and Scripting Interpreter: PowerShell. You can check the "include legacy tags" checkbox to include these in the search.
By Threat Actor
When content is tagged with an ATT&CK tag, it inherits the group mappings provided by MITRE. You can search or filter content based on one or more threat actors.
By Tag
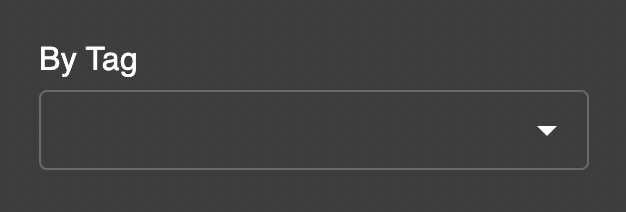
Tags are flexible and can be applied to all content items. We use them for things like attack frameworks (e.g., atomic_red_team, metasploit, cobalt_strike), detection languages or sources (e.g., sigma, carbon_black), attacker campaigns (e.g., solarwinds), and CVEs. Internally, you can use them for anything. Some of our customer use cases include mapping back to a Jira or Service Now ticket, additional workflow states like "needs improvement" or "backlog", tracking content with internal identifiers, and grouping content together. Keep in mind that if you share content outside your organization, it will also have these tags.
By Time
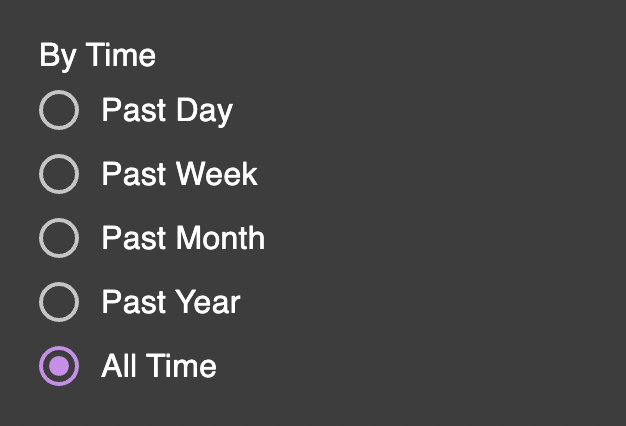
You can filter content by time. We display content by the last updated date, so older content that has had modifications will also appear alongside new content. This helps to ensure changes to content aren't missed.
By Contributor
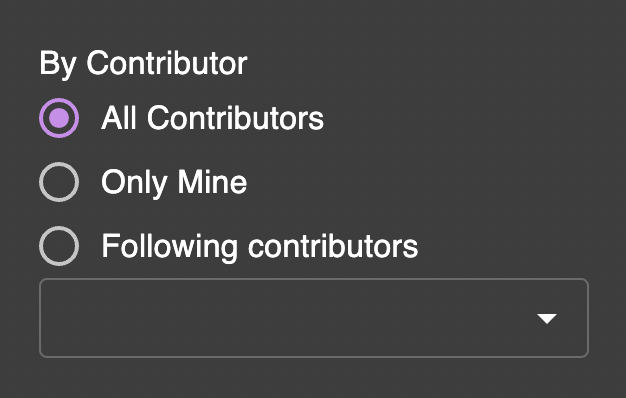
Contributors are the SnapAttack user that published the content. For intelligence and detections, we also track and display separate original author field, which often a user outside of our platform. The original authors are not currently searchable.
By Organization
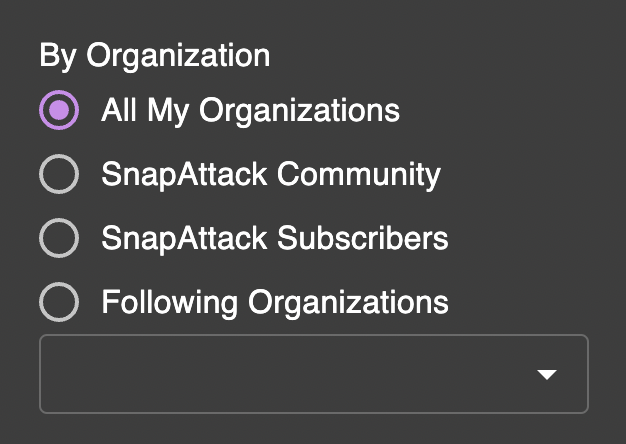
Organizations are how content is shared and restricted. You can think of them as tenants in a multi-tenant environment. Every subscription customer has their own private organization. Subscribers will also have access to subscription content through the "SnapAttack Subscribers" organization. All platform users are members of the "SnapAttack Community" organization.
By Validation Status (for Threats and Detections)
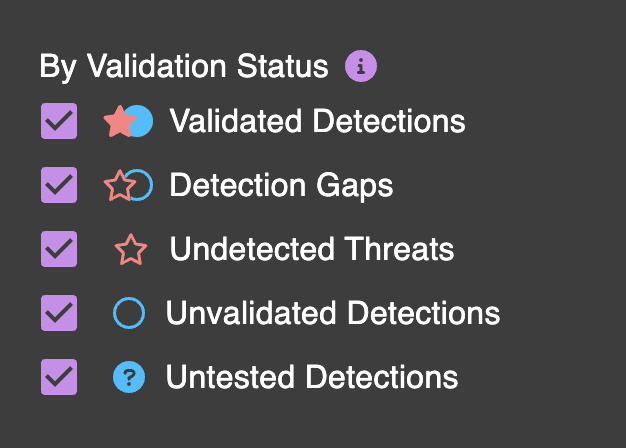
SnapAttack is a living repository of threats and detections — and we're constantly mashing the two together against each other. The result of this is what we call validation status. Validation status is a little different depending on the content type you're viewing. Threats and detections both track validated detections, detection gaps, and unvalidated detections — which are the intersection of red and blue team labels. Threats have an additional status for undetected threats — or labeled attacks that do not have a corresponding detection. Detections have an additional status of untested detections — or detections that have never triggered on a threat in our true positive malicious database.
By Attack Simulation Compatibility (for Threats and Detections)
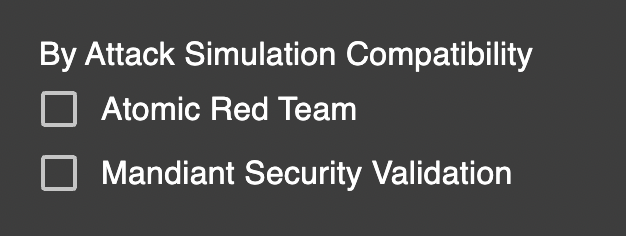
Threats and detections can be filtered by their compatibility with attack simulation frameworks. For threats, this filter will show the attack simulations themselves that we have run in the platform. For detections, this filter will show detections which can be tested by one or more attack simulation test cases.
By Detection (for Threats)
You can use this filter if you wanted to see the all of the captured threats that a specific detection has triggered on.
By Confidence (for Detections)
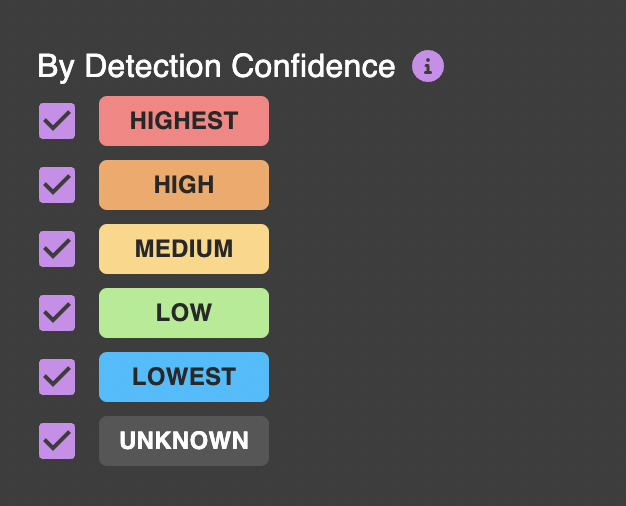
Confidence is a measure of the true positive/false positive ratio for a detection. Highest and high confidence detections will hit very rarely and have little to false positives — these are suitable for deploying as alerts to your security tools. Medium and below confidence detections will have more false positives, but are still suitable for threat hunting or correlation rules. For subscription customers with configured integrations, confidence is calculated based on your organization's data. If that is not available, we fall back to a "community confidence" score that is anonymized and calculated across customers and other real-world benign data sets.
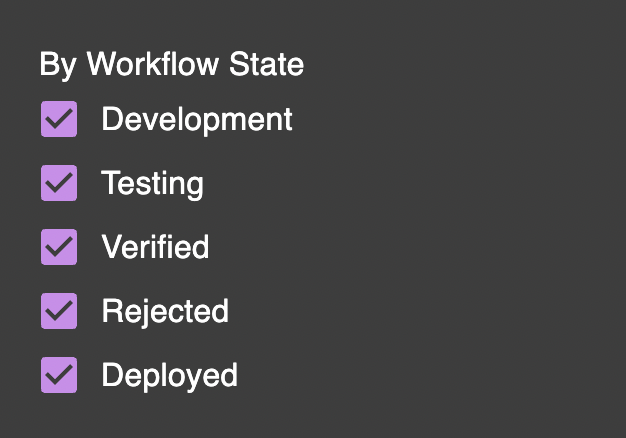
By Workflow State (for Detections)
Detections have additional workflow states that track the detection development lifecycle (DDLC). By default, these are development, testing, verified, rejected, and deployed. This workflow state is only visible to your organization. For example, you can use these filters to find detections that have gone through development and Q&A and are ready for deployment, or detections that are already deployed.
By Supported Language (for Detections)
You can filter detections that are compatible with a specific language — for example, CrowdStrike Falcon or Splunk. Use this filter to find detections compatible with your organization's security tools.
By Log Source (for Detections)
You can also filter detections by their log source — for example, you could apply this filter if you wanted to find detections for data in Windows Event logs or EDR process creation events.
Clearing Filters
There is a default set of filters for each content type. As you make changes to the filters, it will display the number of additional filters that have been applied. You can click this button to clear the filters and reset the search back to the default.
Saving Filters
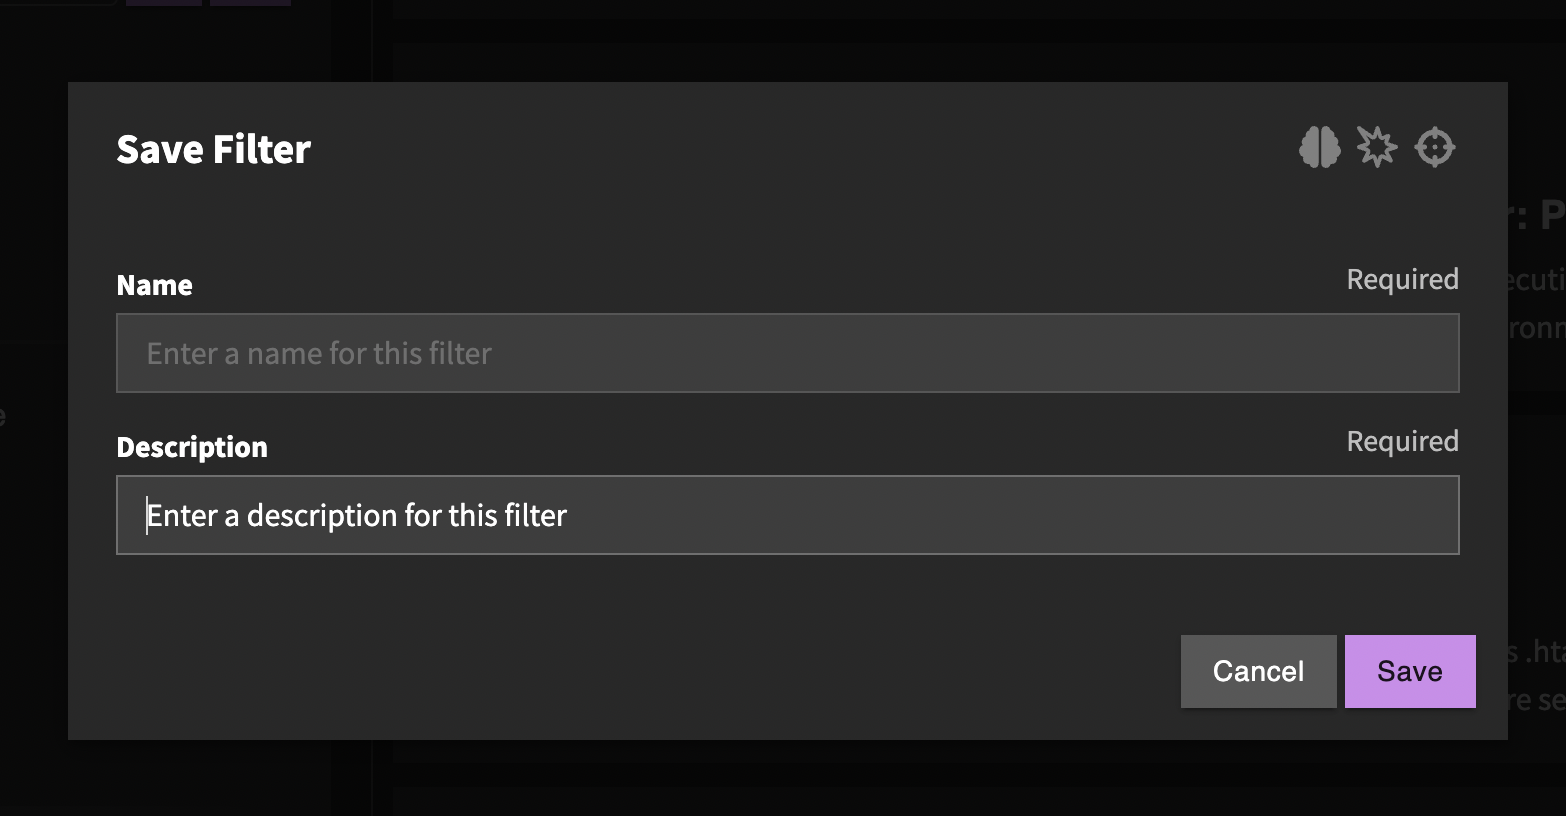
If there are common filter combinations that you use frequently, you can create a saved filter. You can do this by clicking the save icon at the top of the filters sidebar. You can give this saved filter a name and description. The icon will show which content type(s) this filter applies to.
You can also click the filter icon to apply a previously saved filter.
Export (for Detections)
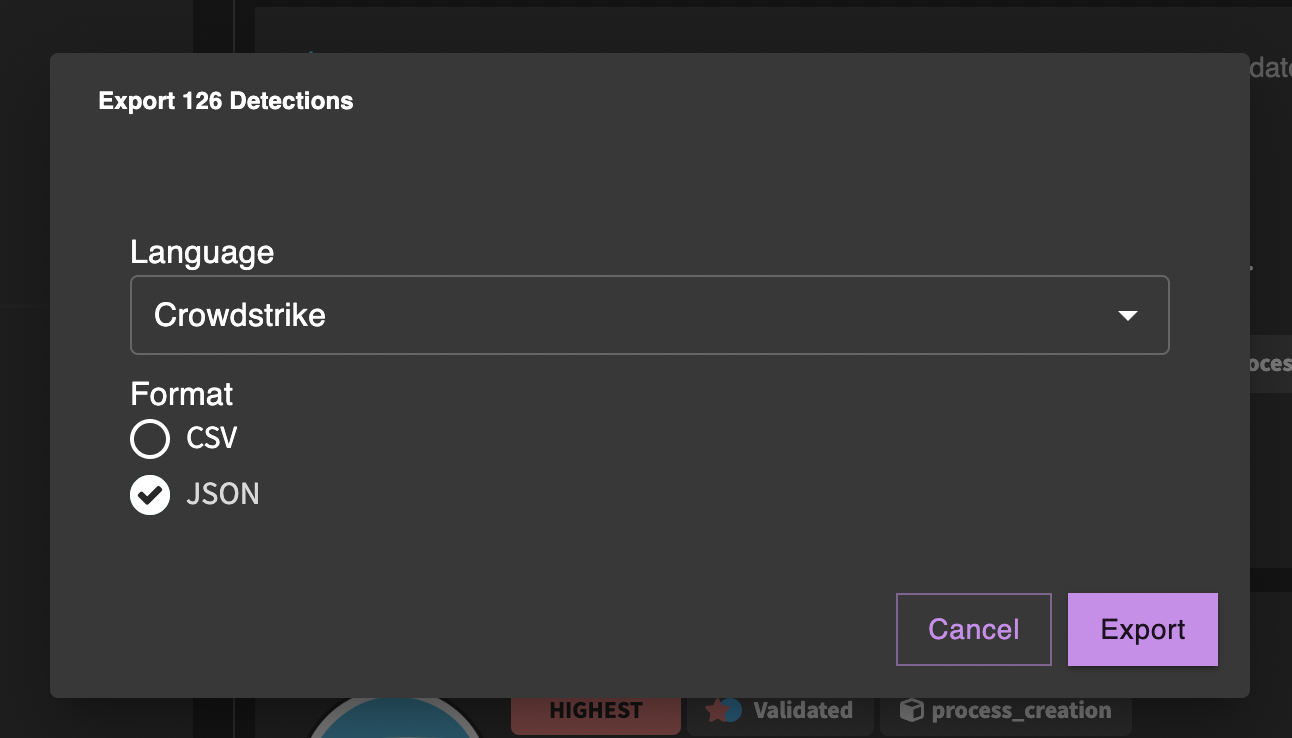
You can export detections from the search page by clicking the export button next to the results count. The detections to be exported will be filtered by search criteria.
For example, you could select only highest and high confidence, validated detections that have a supported language for your SIEM or EDR, and then export just those detections as a CSV or JSON file. The language option will try to translate each detection to the target language — if the translation fails, it will not be included in the export.
