Threats
What are Threats?
Threats are malicious actions that damage or disrupt computer systems or networks. Said more plainly, they are cyber attacks. Threats are carried out by threat actors, which can include state-sponsored groups, criminal organizations, or even motivated individuals. We describe threats in the context of the MITRE ATT&CK framework, which details all of the Tactics, Techniques, and Procedures (TTPs) available to a threat actor.
SnapAttack thinks about threats differently, and it's a central part of our platform. Traditional intelligence isn't often actionable on it own — it's hard to understand how a threat works or how to create detections and alerts without knowing the artifacts it leaves behind. That's why SnapAttack memorializes adversary and red team in our threat library — recording the desktop video, keystrokes, event logs, network packet captures, really anything we can so that the threat can easily be shared and used by members of your team.
Viewing Threats
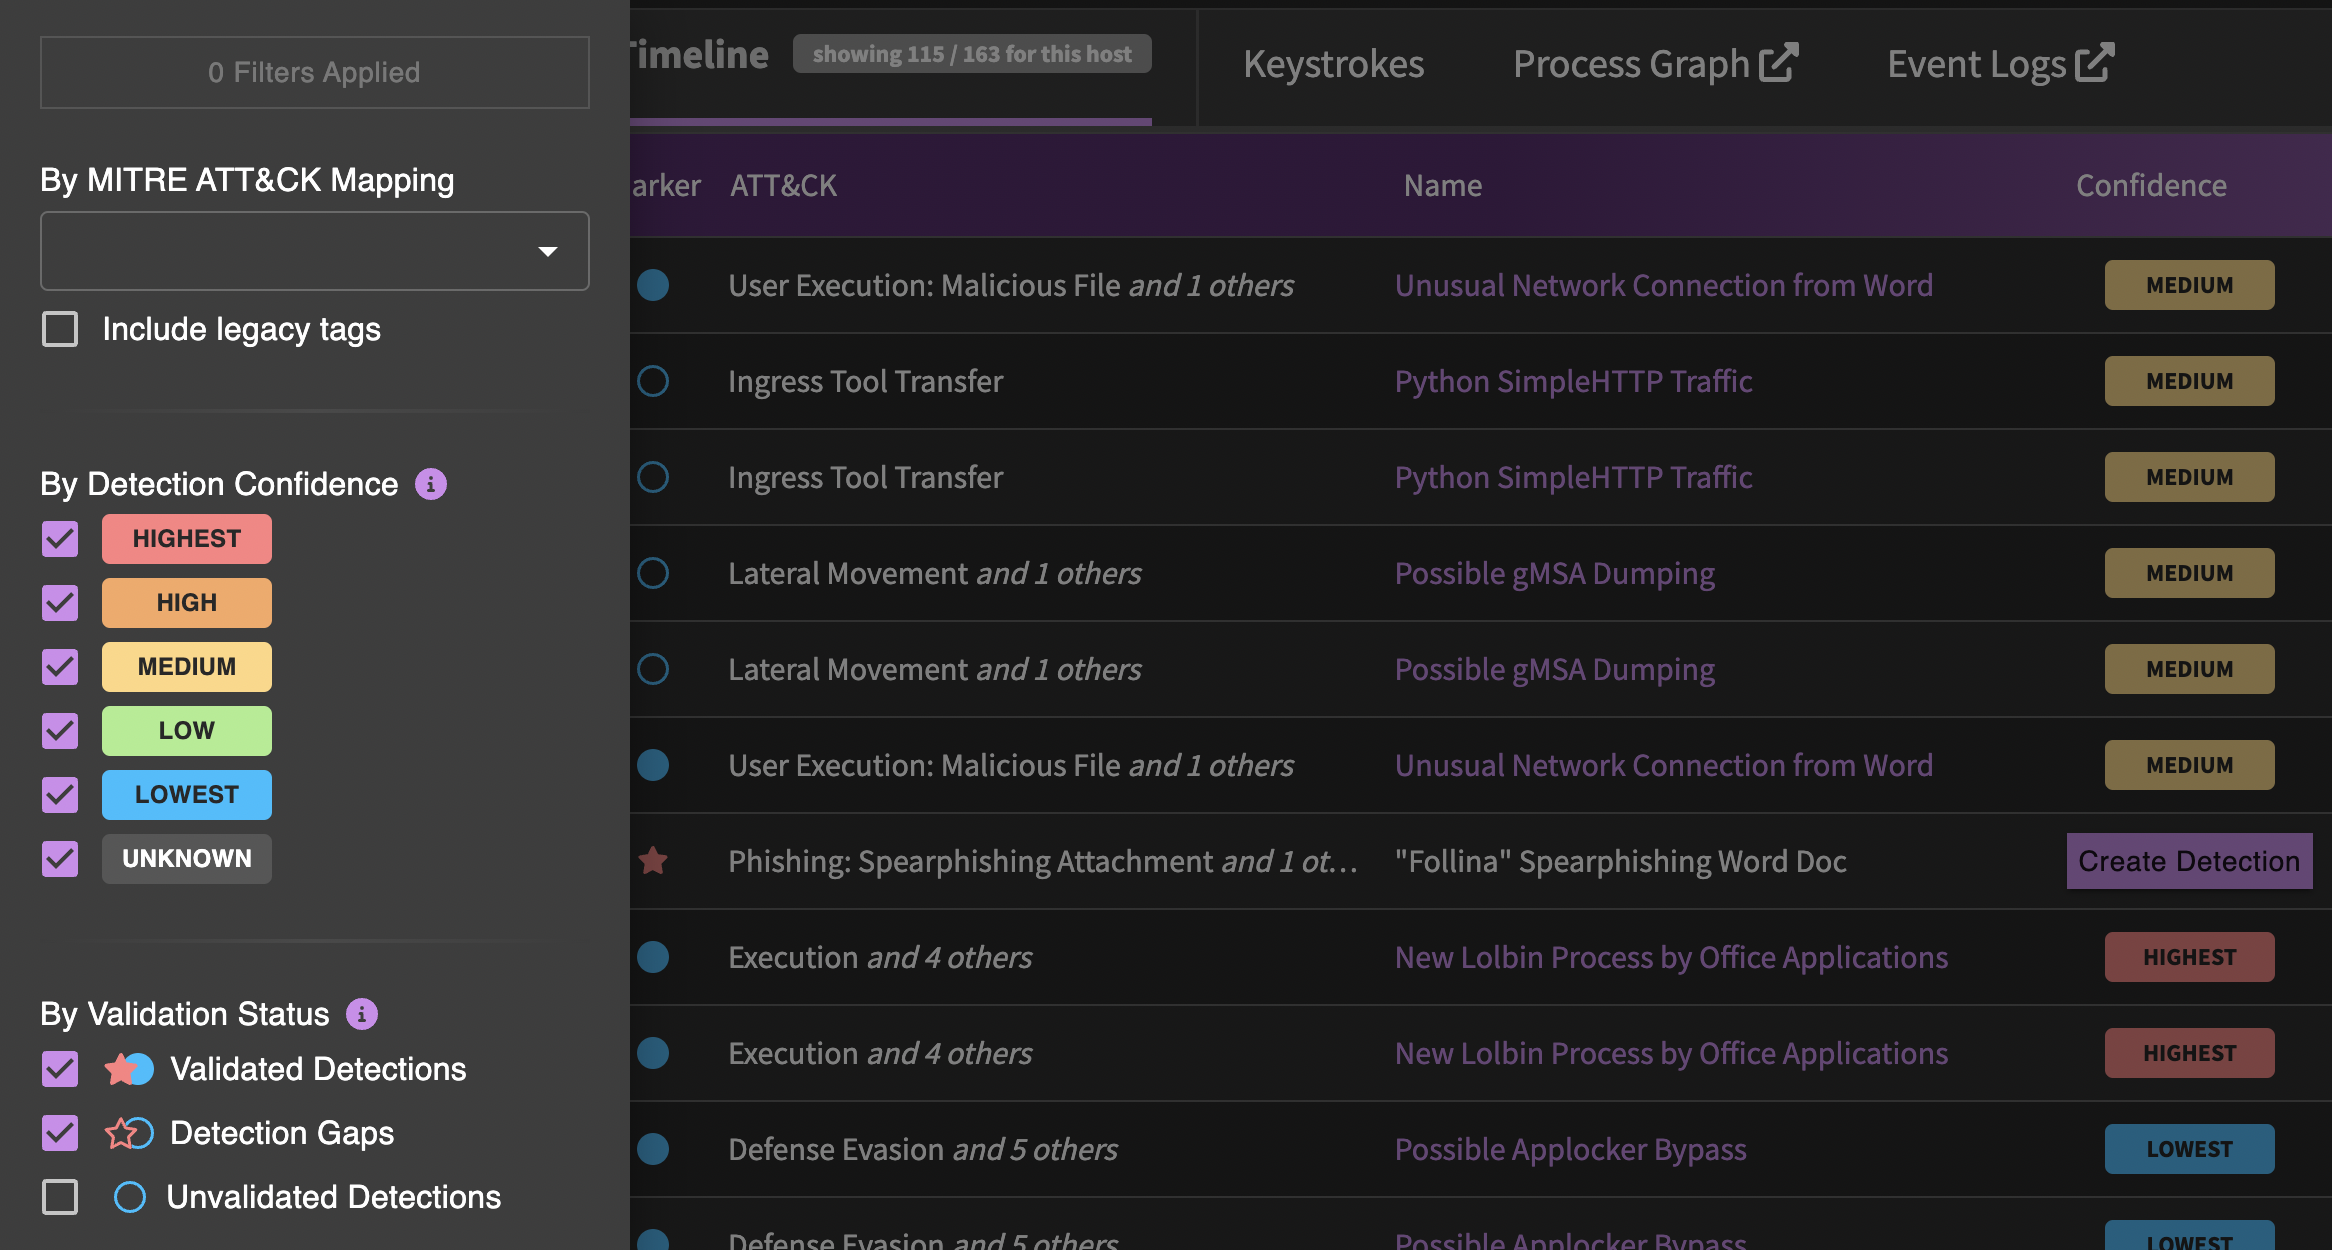
Adversary tradecraft is captured and memorialized in the SnapAttack threat library. You can using searching and filtering to help narrow down and find the threats that you're looking for. Some of the most powerful filters for threats are ATT&CK mapping, threat actor, and validation status. For validation status, you may want to focus on threats with validated detections if you are looking to deploy detections, or you may want to focus on detection gaps or unvalidated detections if you are looking to improve content.
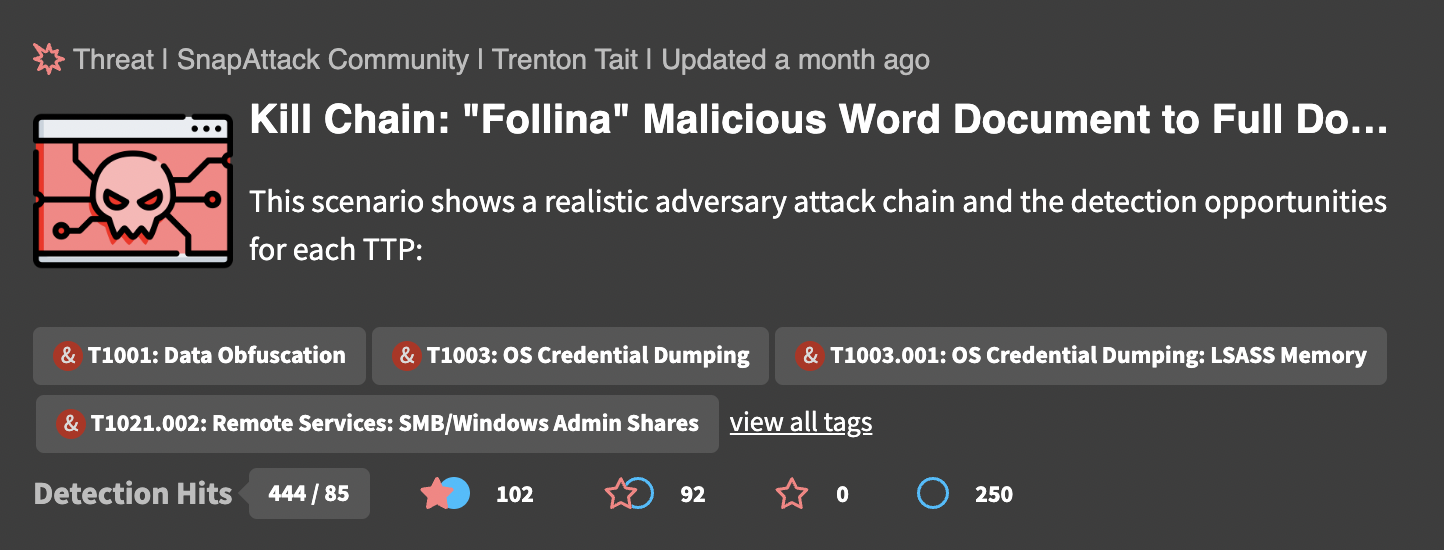
In this example threat from the feed, we can quickly information about the threat — including the title, description, and MITRE ATT&CK techniques. The bottom row shows how many detections have hit on this threat — 444 total detection hits, of which 85 were unique. We can also see that there are 102 validated detections, 92 detection gaps, 0 undetected threats, and 250 unvalidated detections. Clicking on the card will take you to the threat page.
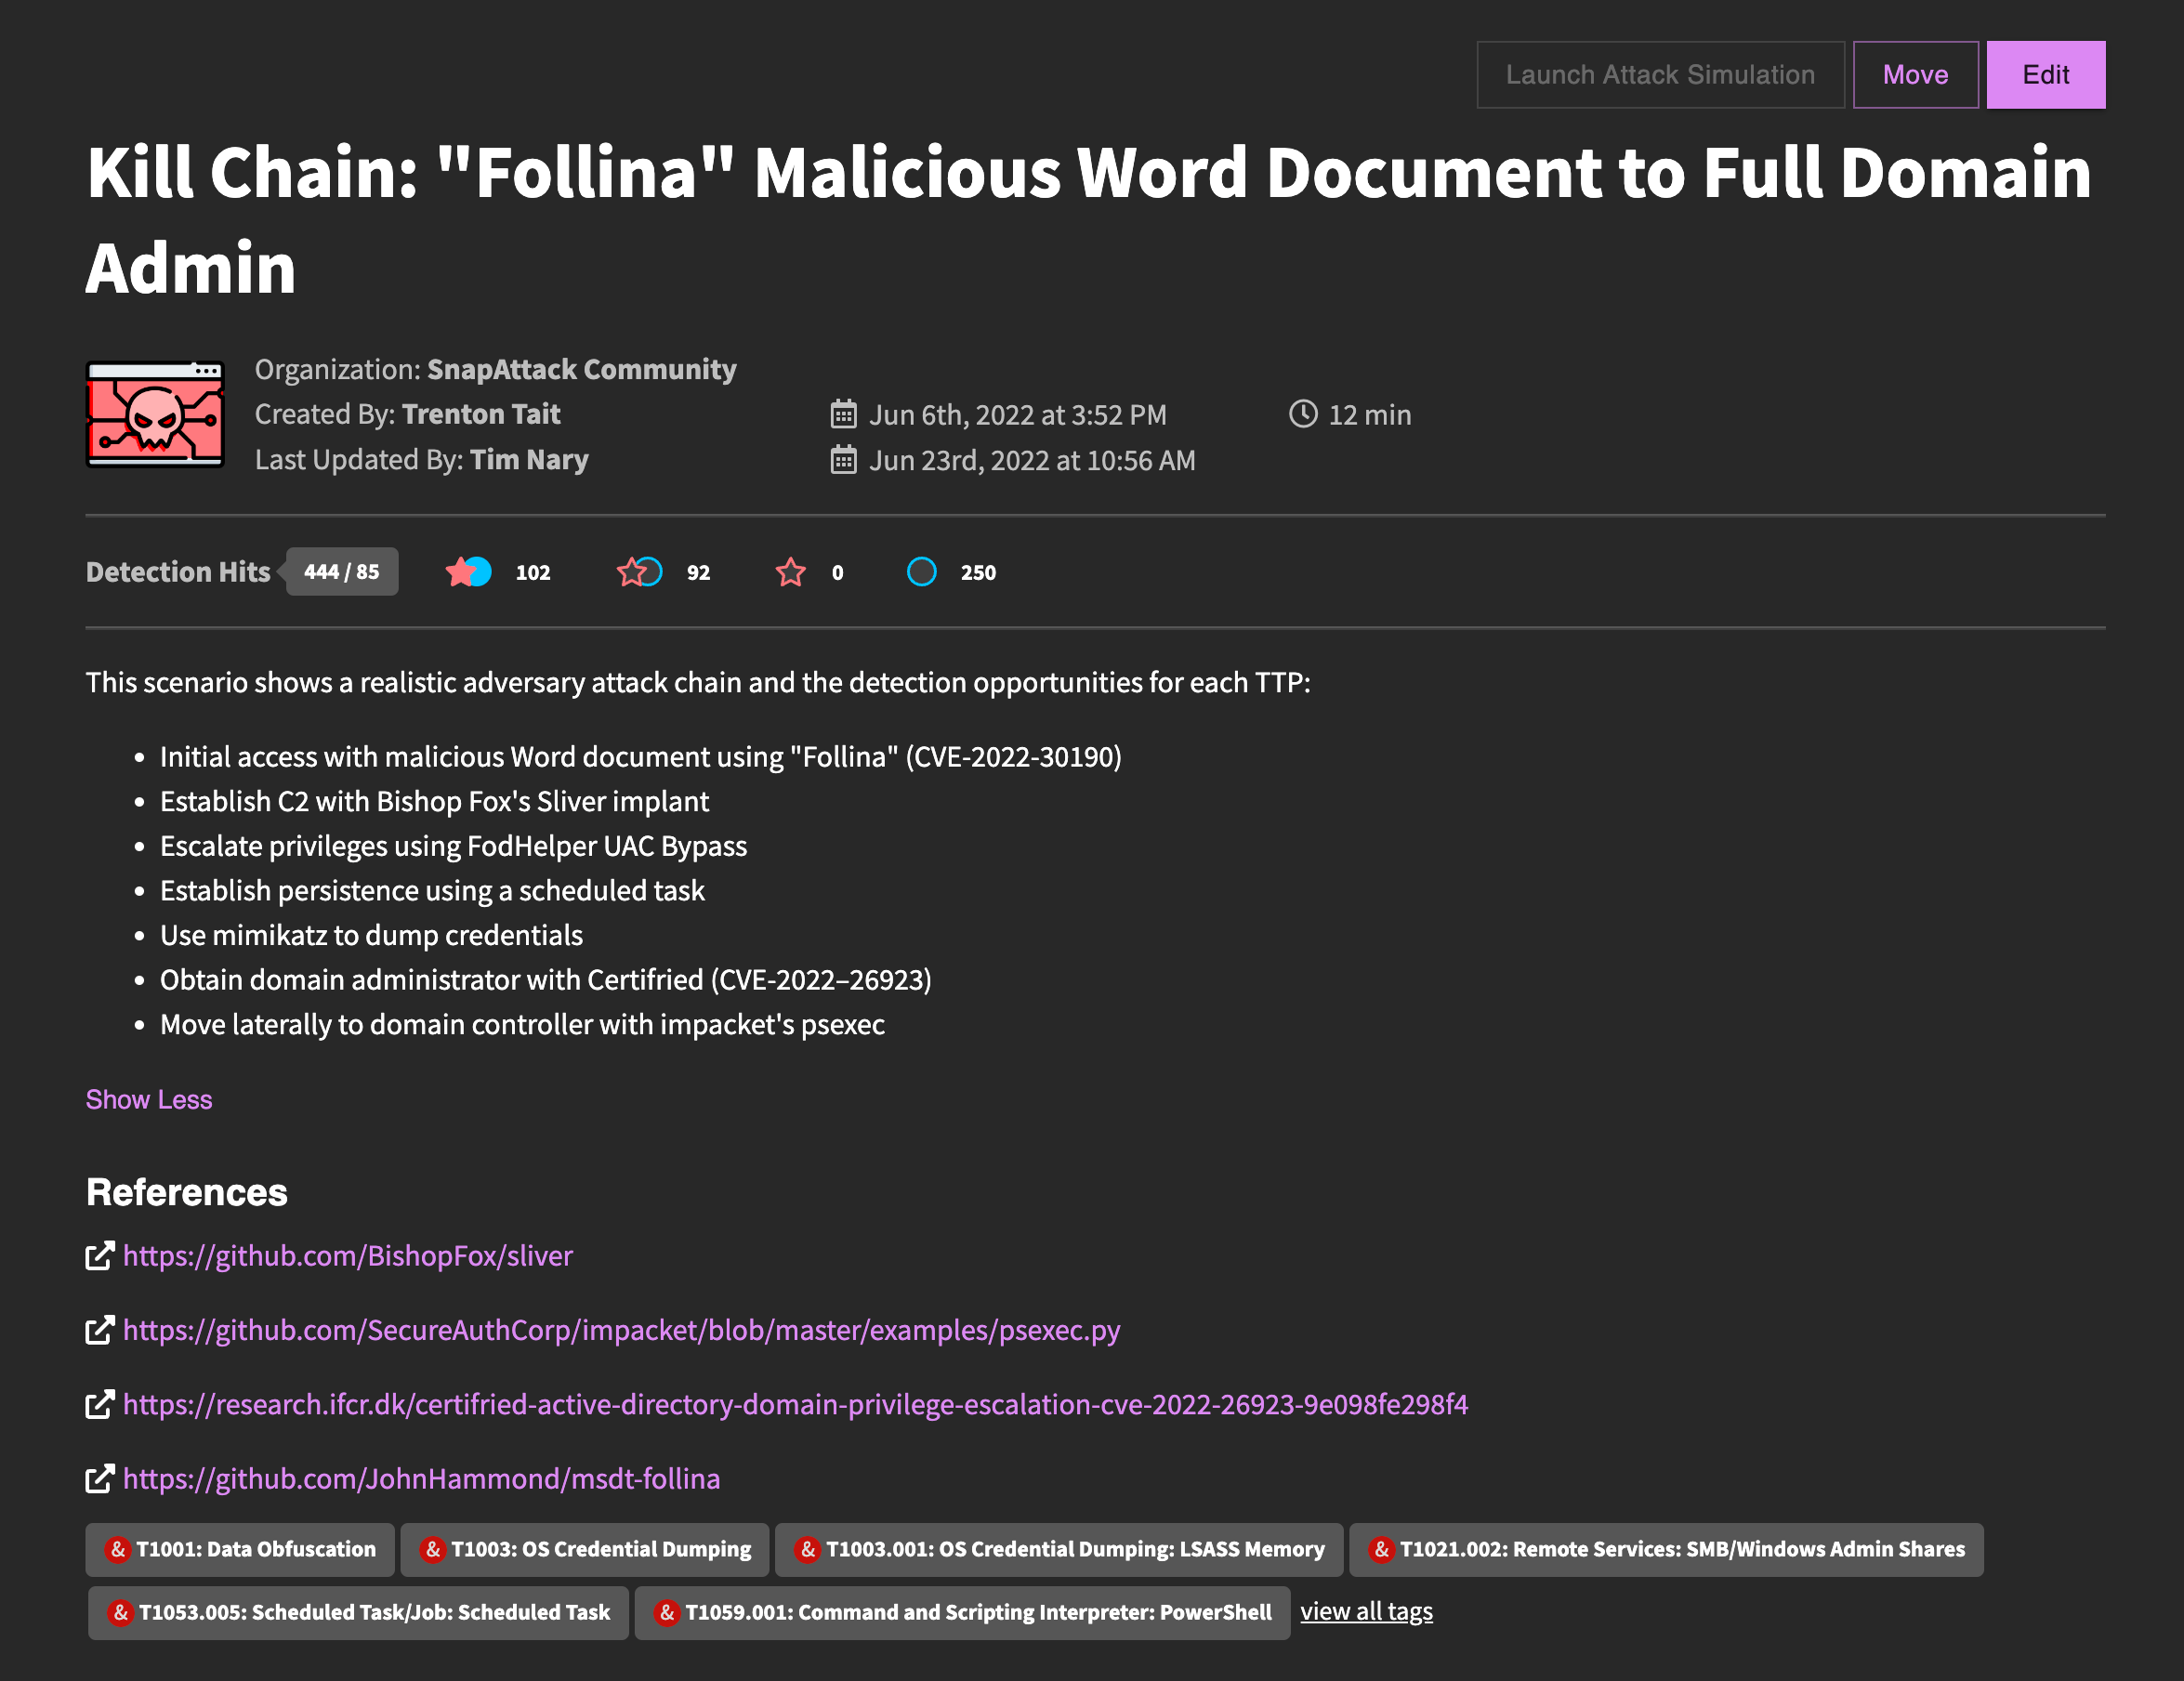
The top portion of the threat page has all of the metadata about the threat. At the top are actions — including the ability to launch an attack simulation, move the threat to another organization, or edit the threat. Below that are the title, validation status metrics, description, references, and MITRE ATT&CK and regular tags. The validation metrics follow the same pattern as on the card from the feed, and let you get an idea of the threat at-a-glance.
Captured Video
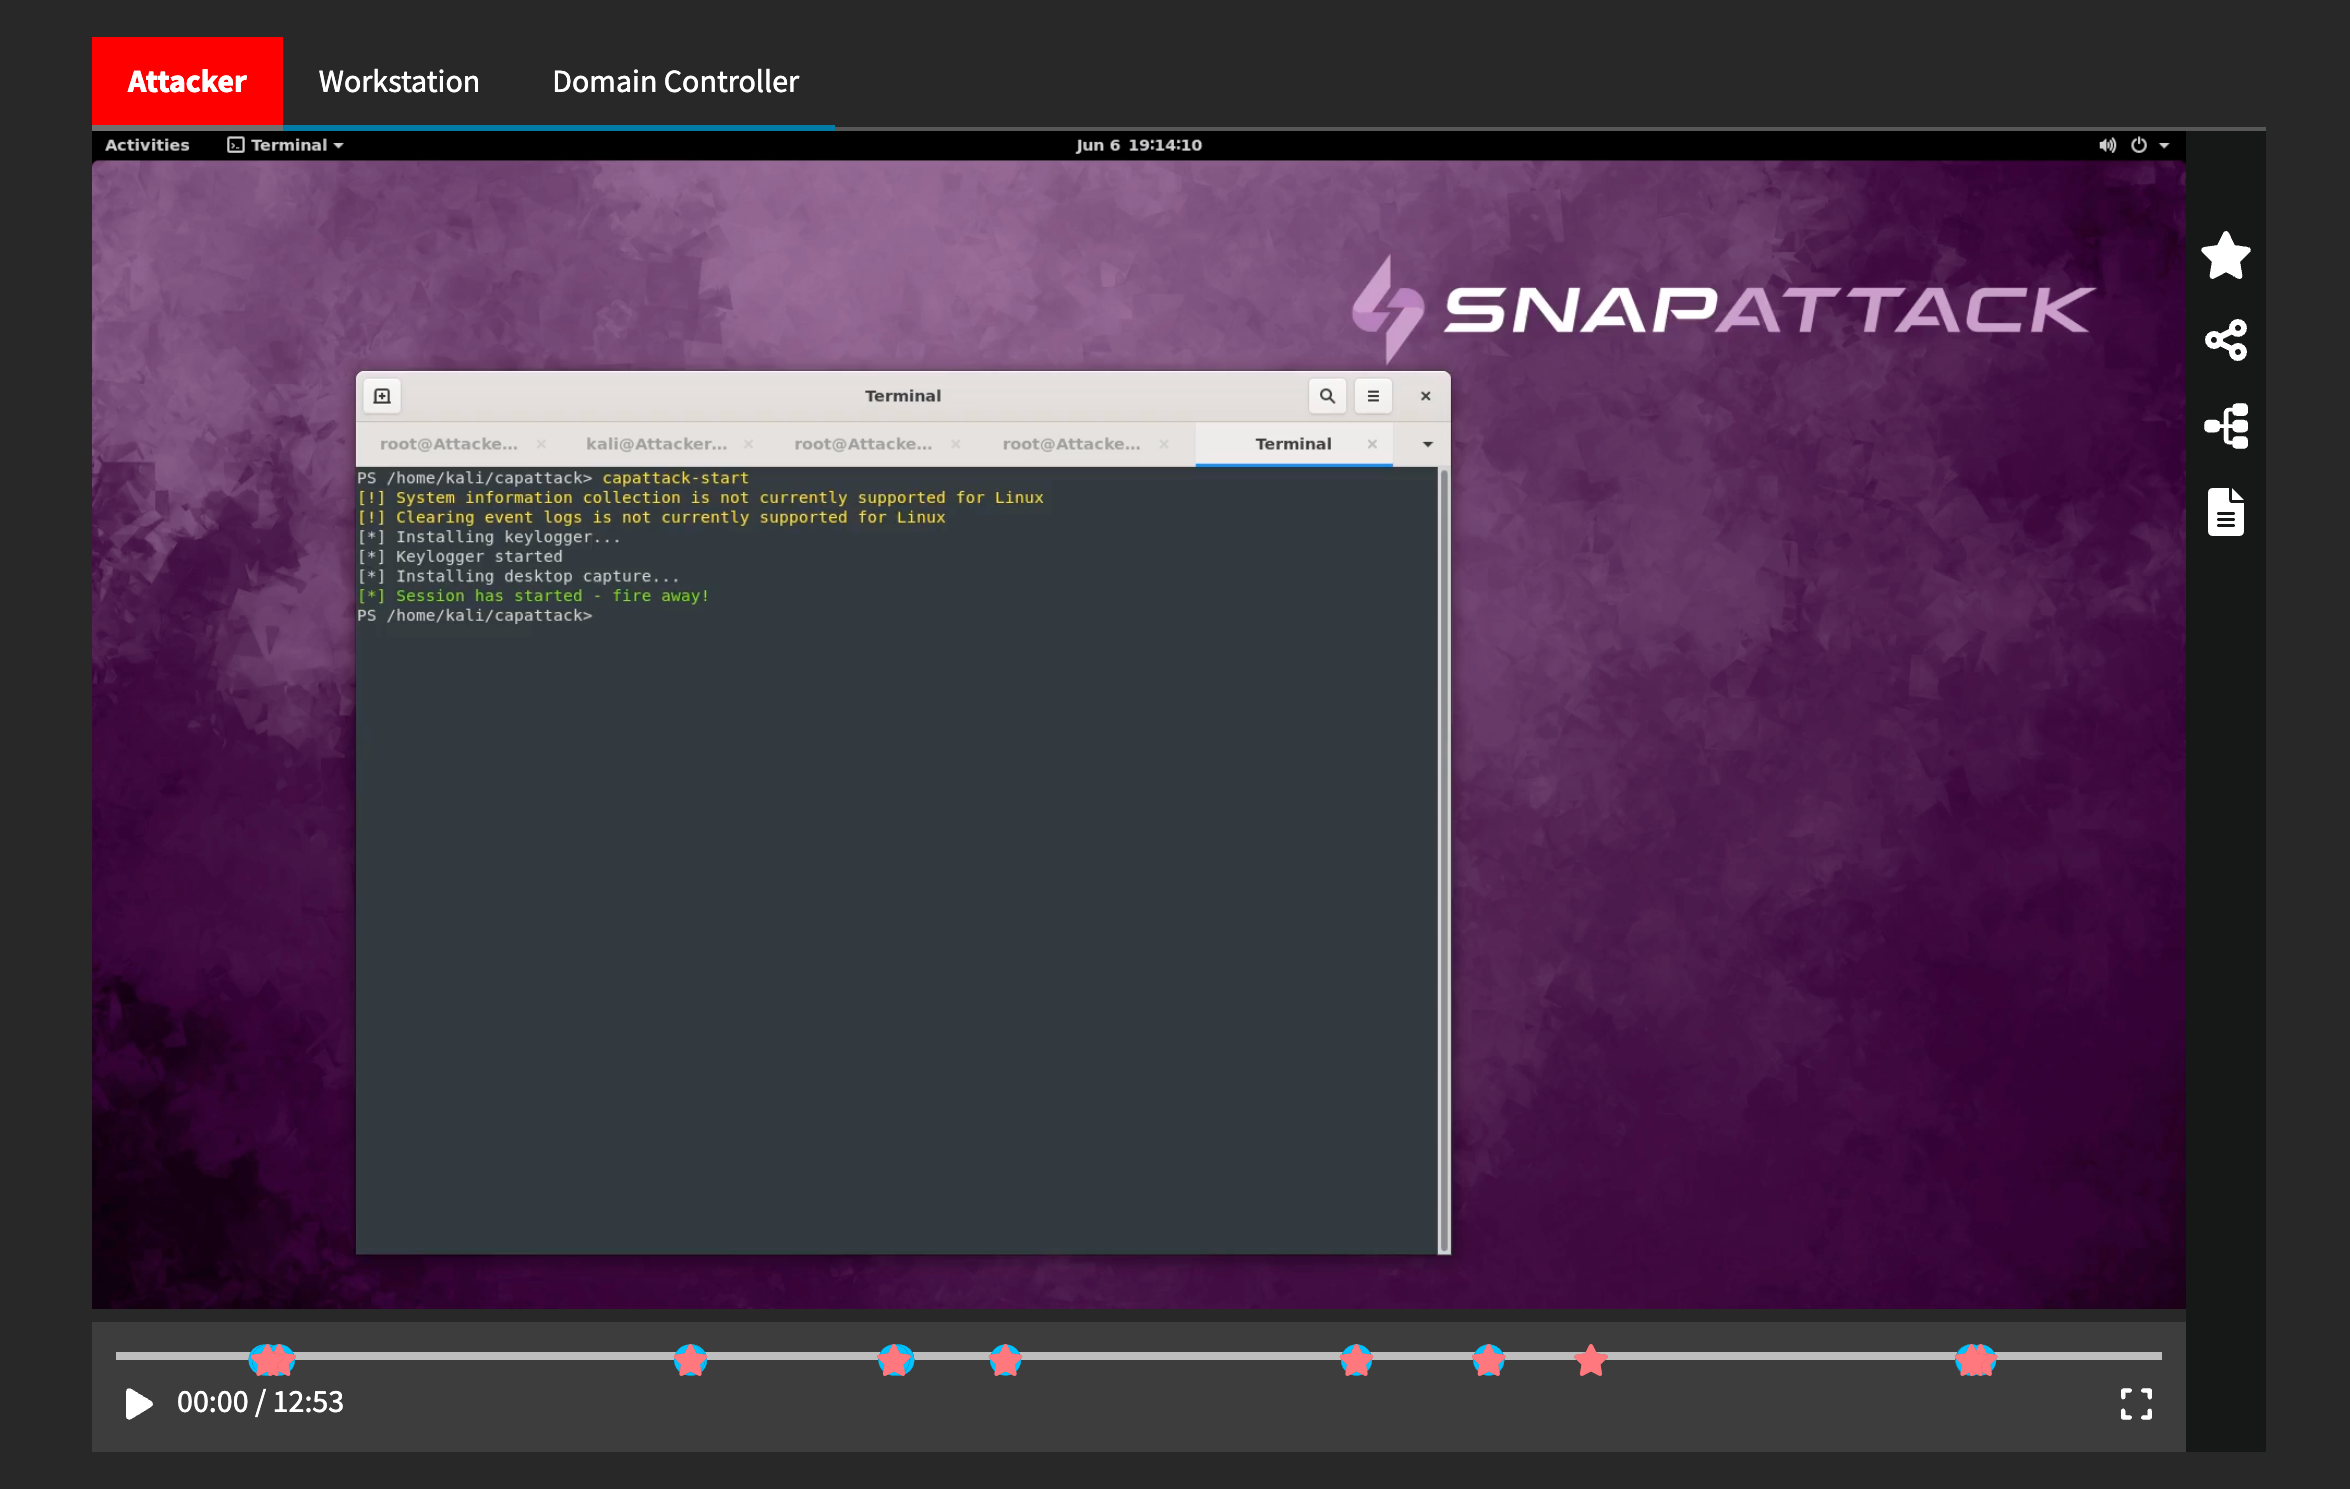
Below the threat metadata is the recorded video. At SnapAttack, we believe this is critical to helping red and blue teams understand the threat. In a real-world incident, you won't have a glimpse into what the hacker was doing, but in SnapAttack you can shoulder surf the attacker and watch their every keystroke. That said, videos may not be available for some threats, such as certain cloud or network-based attacks, servers that run in a headless mode, or threats imported from other projects.
Threats that have multiple hosts will have multiple tabs above the video player. Changing the tab changes the view on everything below it on the page — it will show that host's video in the video player, that host's links to the keystrokes, process graph or event logs, and the markers for that host in the timeline.
Hosts that are designated as a attacker machine will be colored in red.
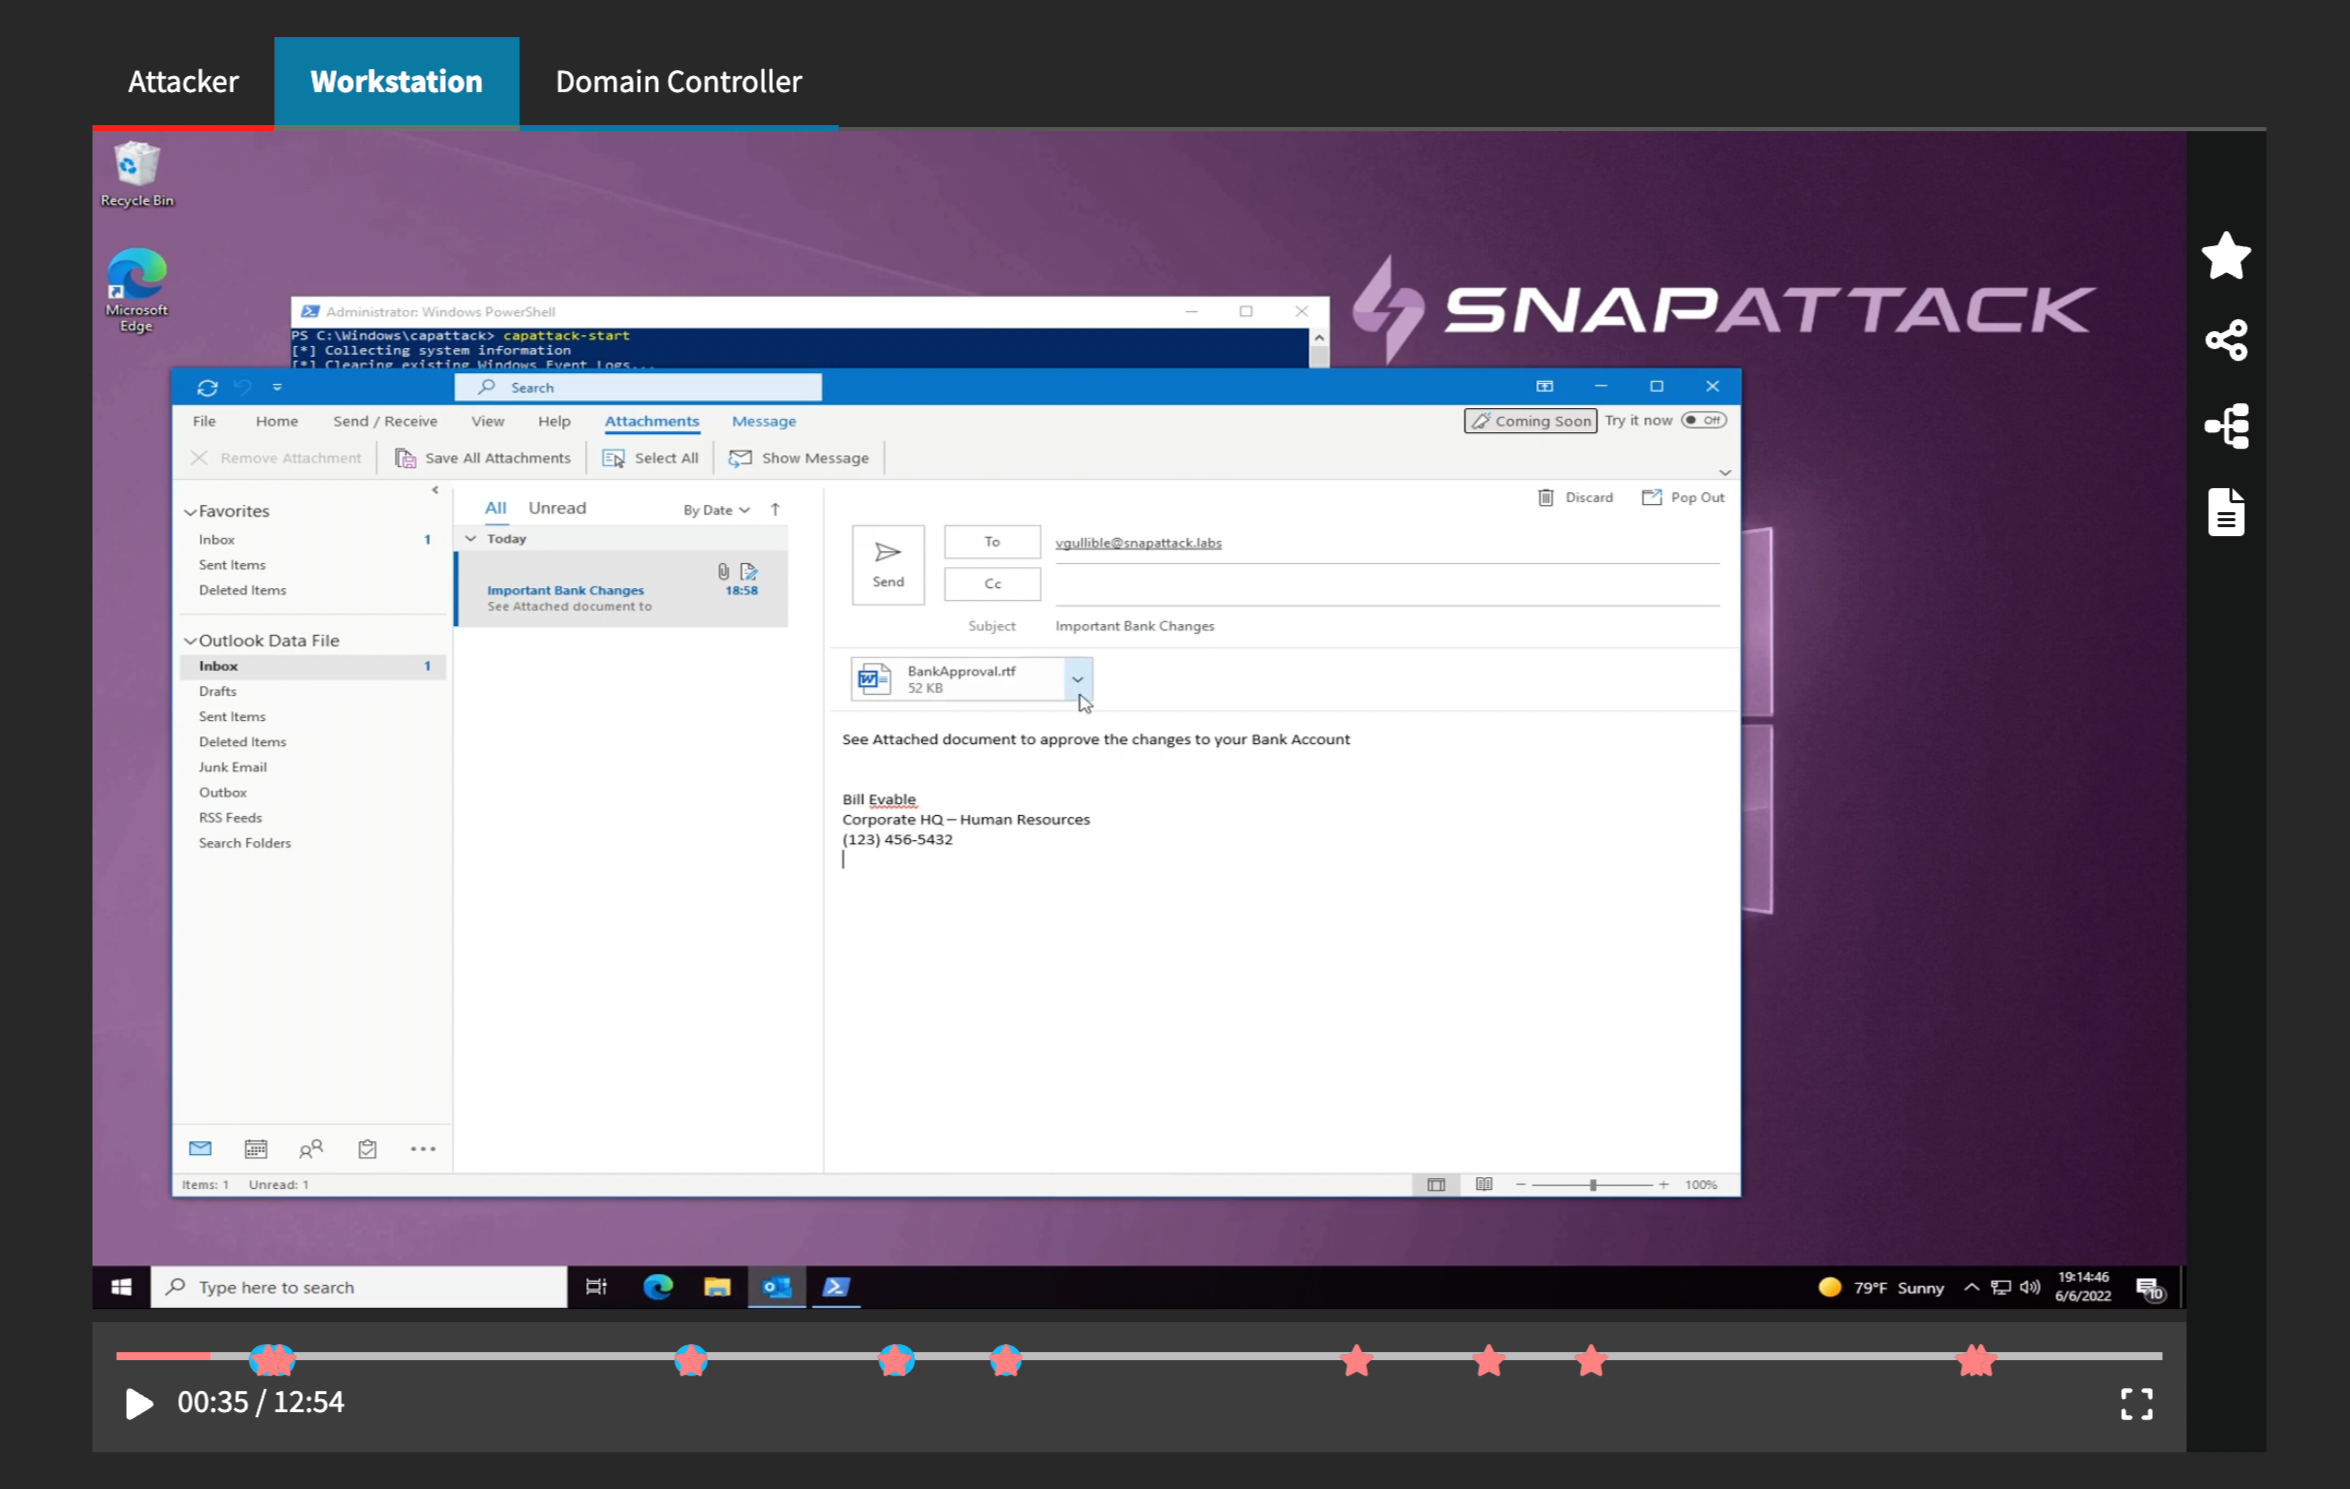
Hosts that are designated as a victim machine will be colored in blue.
Did you know? Colors convey meaning in SnapAttack!
SnapAttack brings red and blue teams together. The colors in the platform are very intentional. Often, if something is colored red — from a  threat, to a
  labeled attack, or the color of a host tab — we are conveying that it belongs to a threat actor or the red team. If something is colored blue — from a
  detection, or a
  detection hit, or the color of a host tab — we are conveying that it belongs to the defender or blue team.
You can pause the video at any time and jump between hosts to see what activity was occurring at that time. Additionally, the buttons on the right side of the video player are affected by the video time. You can label an attack, share the threat URL with an offset to that exact time, view the process graph for that host near that time, or view the event logs for that host near that time.
On the video player timeline, we overlay the the labeled attacks and detection hits at the exact time they occurred, so you can jump to that spot on the video and see what was happening on the host. Labeled attacks appear as red stars when they have one or more corresponding detection hit, and  hollow red stars when they are gaps are not detected. Detection hits are calculated for every detection in the platform, and will appear as blue circles when they detect an attack, and
  hollow blue circles when they are gaps and not detecting an actual threat. These detection gaps may or may not be false positive hits — if they aren't, consider labeling an attack to improve the quality of the content.
It's also important to note that labeled attacks will appear on every host tab — that way, you can jump to any host and see the malicious activity that was going on at that time. All detection hits will appear on the attacker machines for that reason as well — so that red teams can track their OPSEC and see what artifacts they are leaving behind. On victim machines, blue markers will only appear for that specific host.
Threat Timeline
Below the video is the threat timeline. This table provides a more detailed view of what's going on in the captured threat. At the top of the table from left to right, there are buttons to filter the displayed markers, pause or active autoscroll for the table, view attack simulation results (if the threat is simulatable), keystrokes, process graph or event logs (if a victim machine). These links, and the markers displayed on the table itself, change based on the active tab selected above the video player.
Each row in the timeline table represents a labelled attack or detection (collectively referred to as markers). The time offset shows when in the video the event occurred, and you can click it to jump to that time in the video. Videos are padded so that you can see what was happening on each host at the exact same time.
The marker column denotes whether the marker is a labeled attack or detection hit, and will be colored according to its validation status. You can read more about validation criteria and how the validation status is calculated.
The next columns display the MITRE ATT&CK mappings and detection names — you can hover over these to get additional information that is not displayed in the row. The confidence column display's the detection's confidence level, or a button to create a detection for red markers.
The actions column will vary a bit depending on the marker type and data available, but it my contain buttons to label an attack, create a detection, view the process graph or event logs.
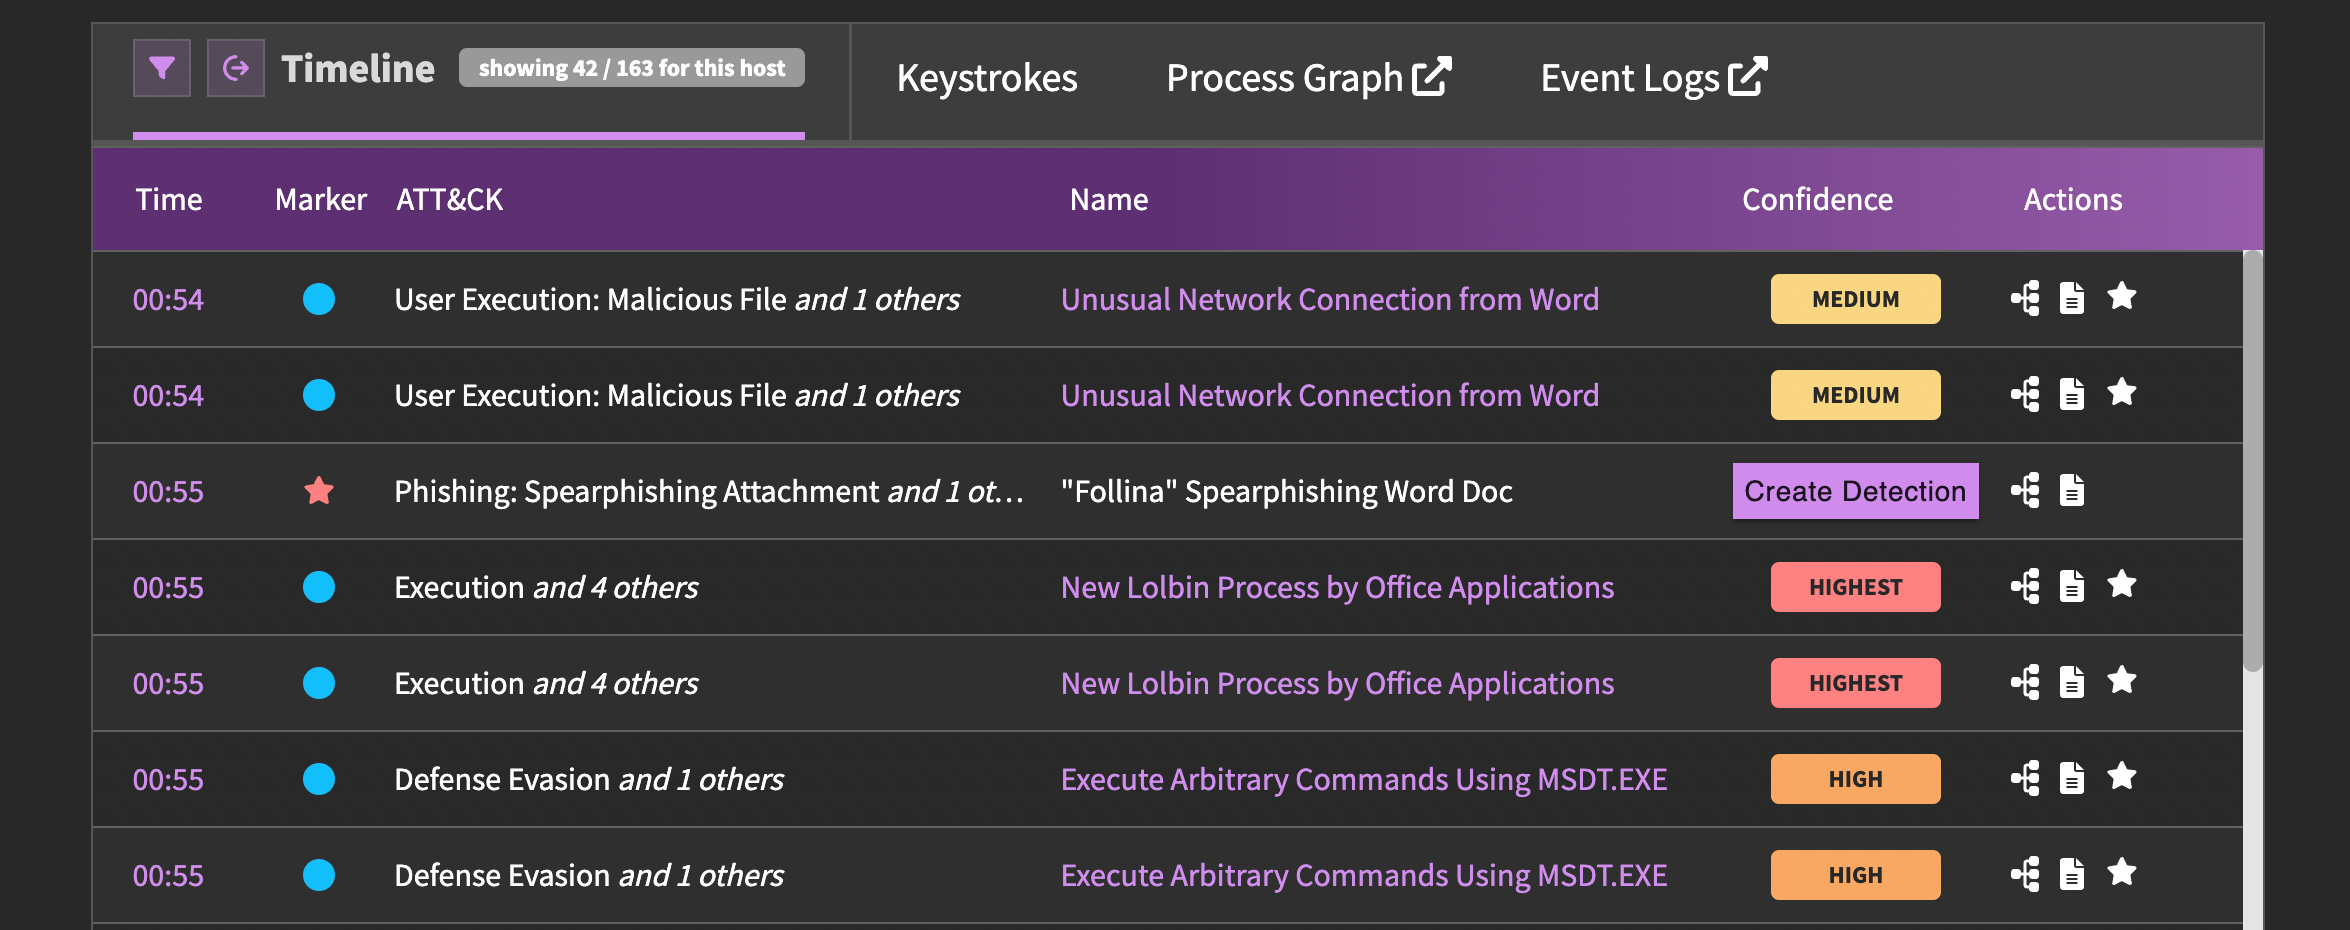
You can click the filter button a the top left of the timeline table to apply marker filters. By default, we show markers of all confidence levels, but will hide unvalidated detection hits as they are likely false positives, unless there are no labeled attacks for that threat.
Capturing Threats
We use a tool called CapAttack to capture everything about a threat. There are two ways to use CapAttack — either in your own environment (what we refer to as a "local capture") or on our provided infrastructure.
CapAttack is cross-platform PowerShell module that requires PowerShell v5+. It currently runs on Windows 7 or newer, Windows 2016 or newer, Kali Linux, and Ubuntu Linux 14.04 or newer. Support for additional operating systems will be added in the future. Administrator or root permissions are required for CapAttack install logging tools (e.g., Sysmon) and retrieve event logs and network packet captures.
CapAttack will automatically check for updates on launch, and can download and install new versions. It is not currenly distributed for offline or air-gapped networks, but you can copy all of the files from the lib directory of an existing installation to a non-Internet connected machine.
We do not recommend running CapAttack on production systems.
Local Capture with CapAttack
In the site navigation, you can go to "Threats" → "Upload Existing Captured Threat" to upload a threat captured with CapAttack. This page also has a help drawer with instructions for downloading and installing CapAttack.
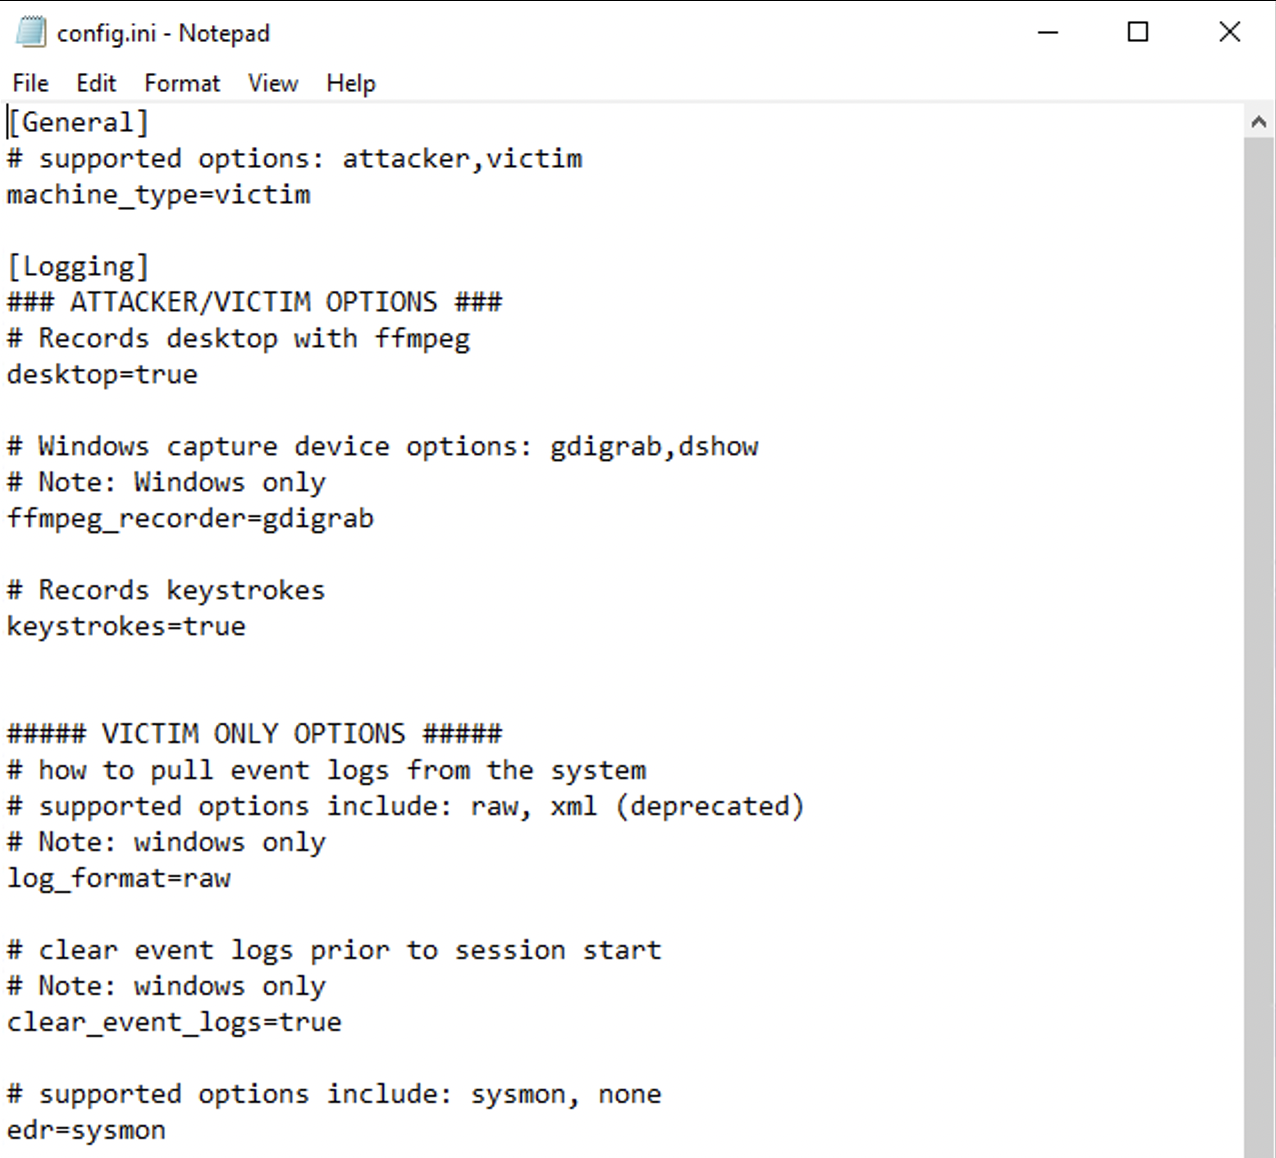
The first thing you should do is review the config.ini file. During installation, it will prompt you if this machine should be designated as a 'victim' or 'attacker'. Event logs are not captured from attacker machines because you would not have access to them in the real world, but CapAttack does capture the video, keystrokes and network packet capture, if configured.
To install CapAttack, simply use the PowerShell one-liner or download the .zip file provided on the "Upload Existing Captured Threat" page. If you are downloading the .zip, you will need to extract the archive, launch PowerShell as an Administrator/root, and run import-module .\capattack.psd1. Depending on your configuration, you may need to run Set-ExecutionPolicy bypass if you receive a warning that modules or scripts are blocked.
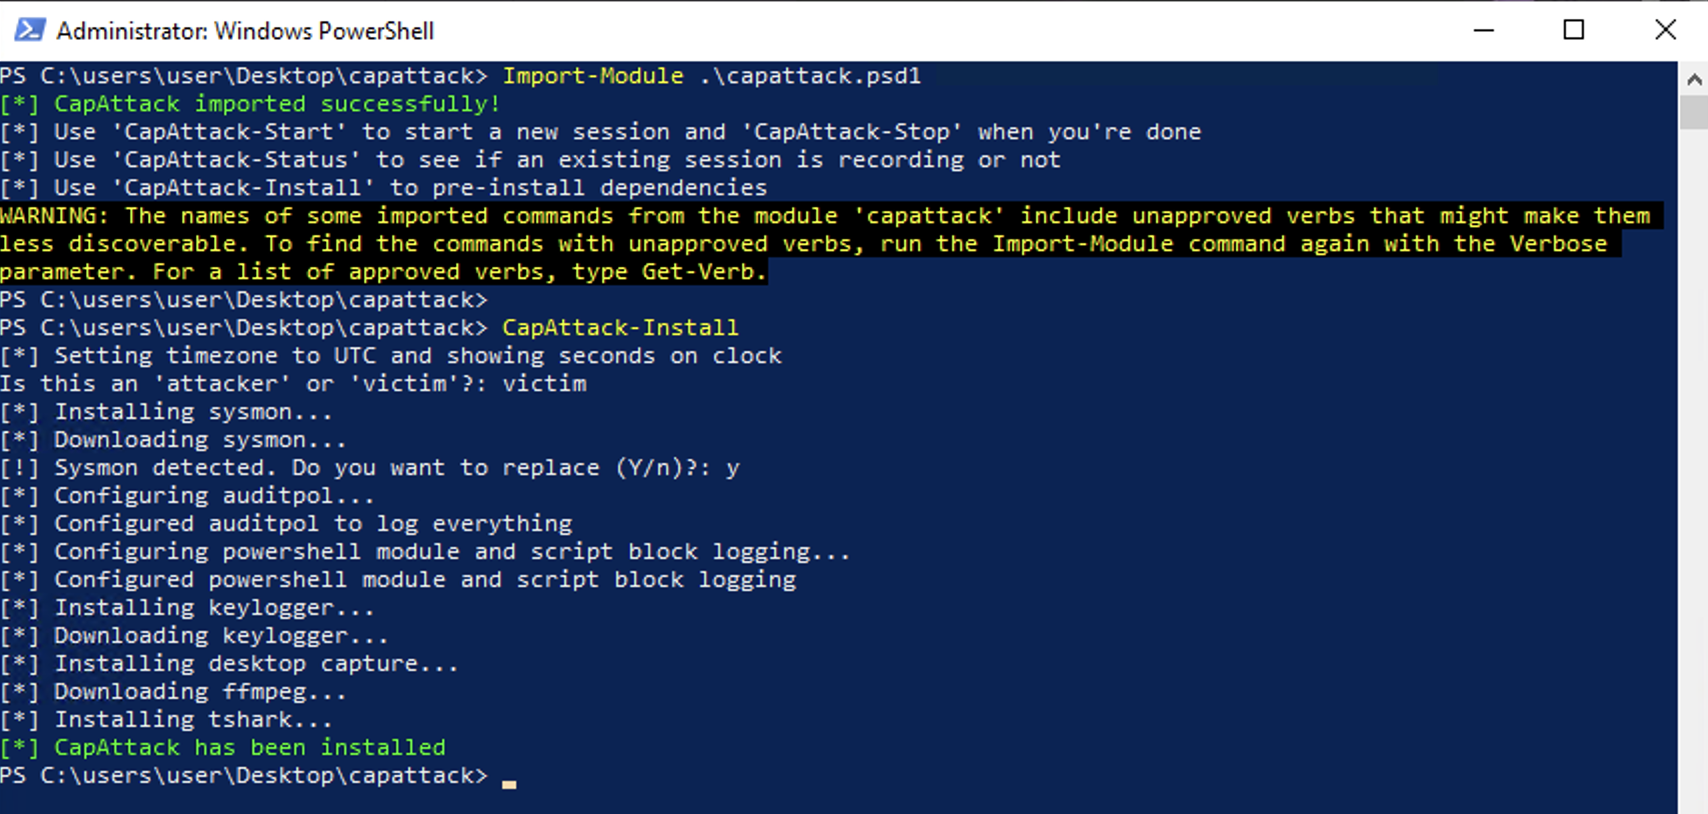
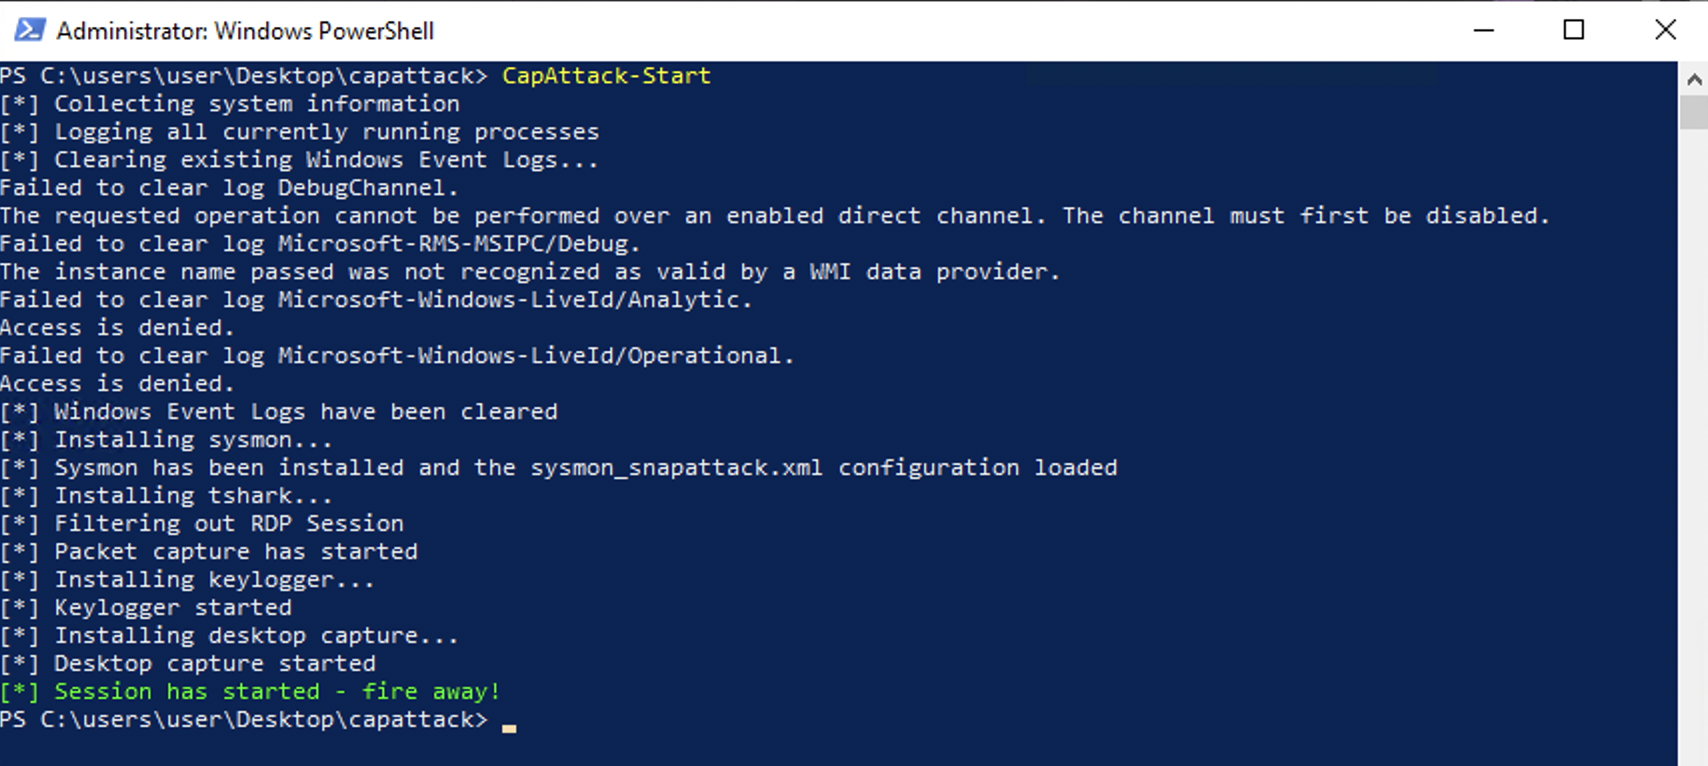
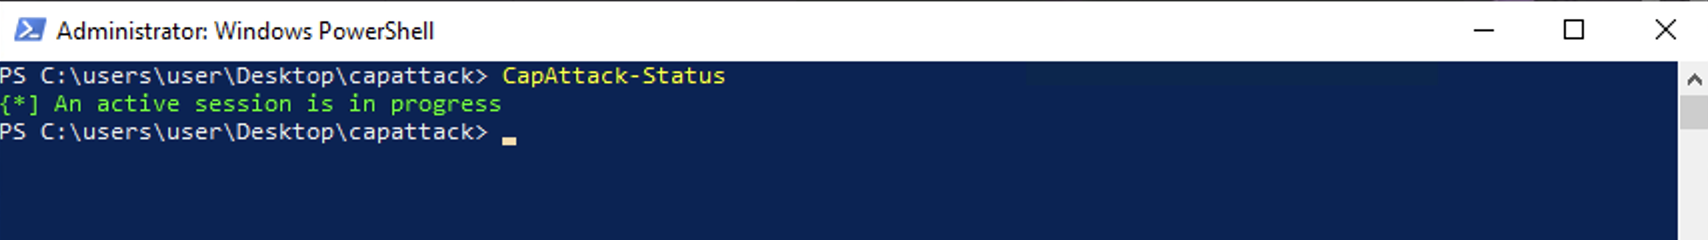
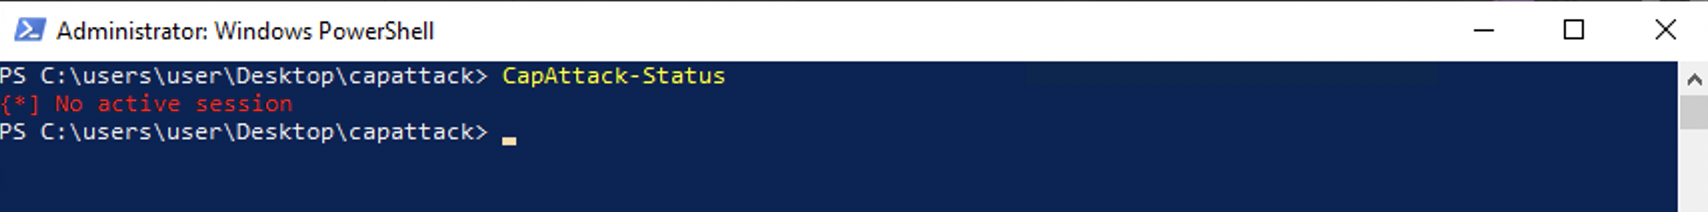
CapAttack has four functions. CapAttack-Start will start a capture. CapAttack-Stop will stop a capture. CapAttack-Status will let you know if an existing capture is running. CapAttack-Install will install CapAttack, and only needs to be run once on first run.
CapAttack-Start will configure all of the tools to capture your threat — including ffmpeg for video capture, a keylogger for keystrokes, wireshark (tshark) for packet capture, and Sysmon for endpoint event logs. It will also configure additional logging facilities, such as Windows events and PowerShell logging. When CapAtttack says "fire when ready", you can begin your attack. Keep the PowerShell window open (but you can minimize it) during the duration of your attack, so that you can quickly stop it when done.
We recommend completing all prerequisites before you start your capture that you do not want included in the video, such as installing or configuring software, joining machines to a domain, etc.
You can use CapAttack-Status to see if there's an active capture.
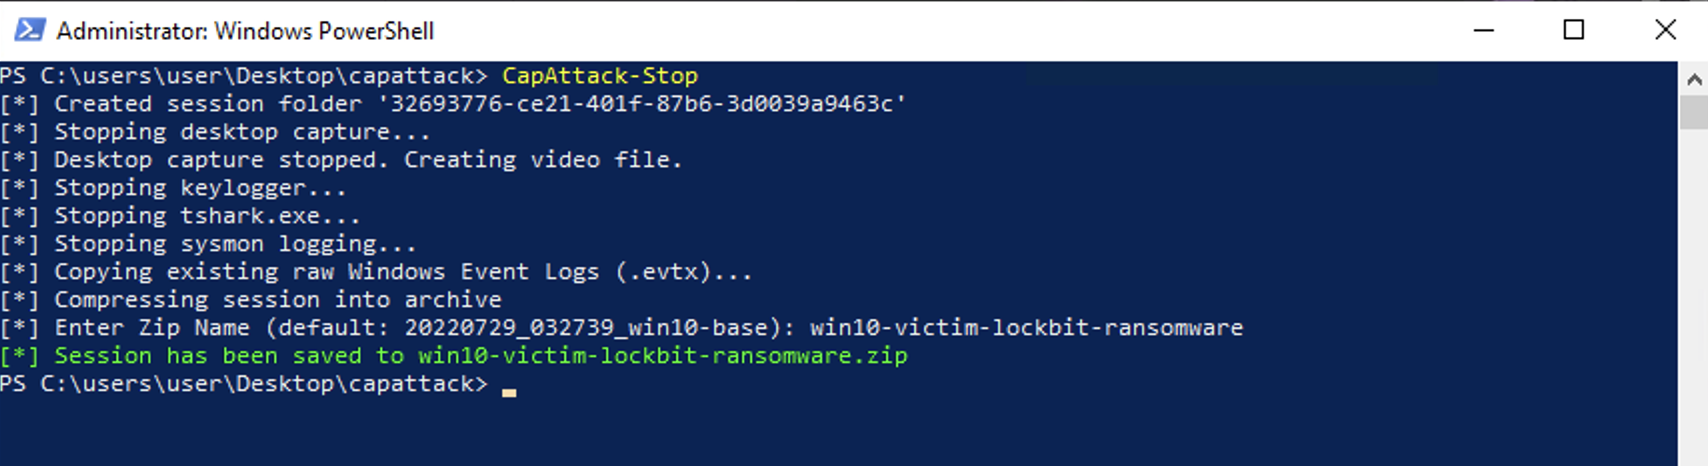
When you are done with capture, you can run the CapAttack-Stop command. This will tear down all of the capture tools and bundle everything into a .zip file that you can upload to SnapAttack. You may choose a helpful filename if you are capturing multiple threats.
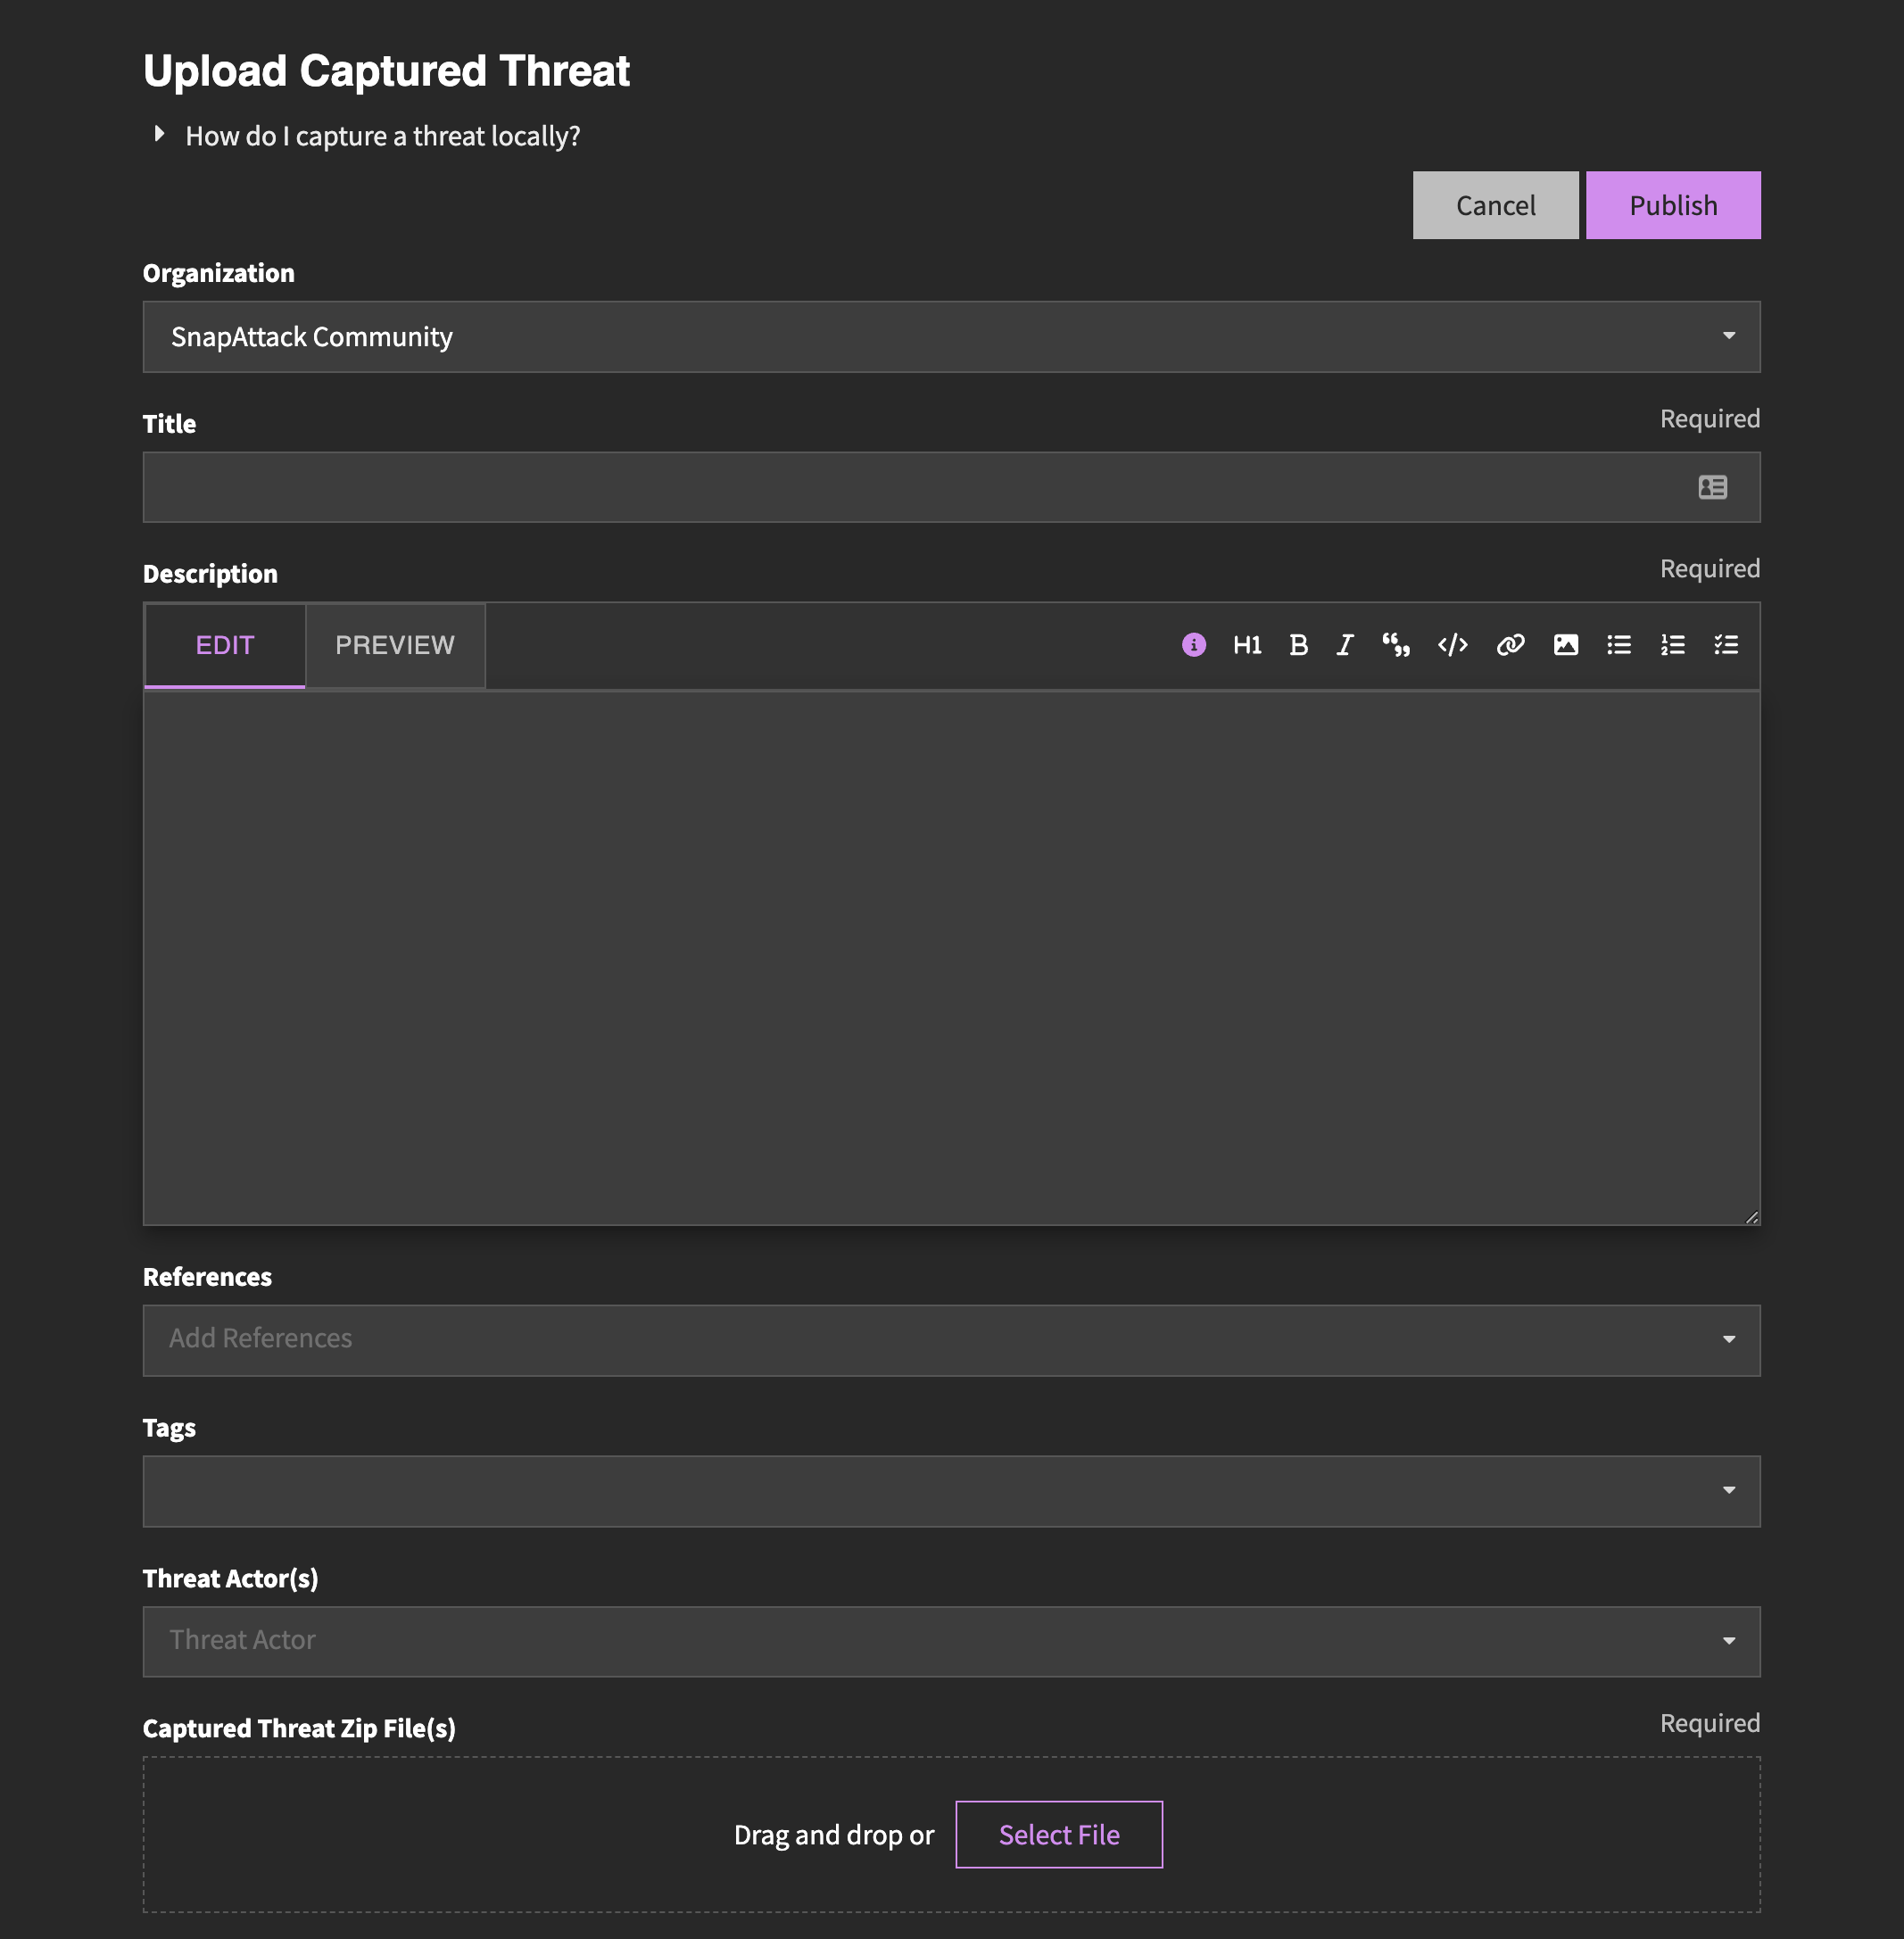
When you are done with your capture, you can navigate to "Threats" → "Upload Existing Captured Threat" in SnapAttack and complete the form to upload the captured threat.
If you need additional step-by-step instructions, or prefer video tutorials, you can watch the CapAttack tutorial below.
Capture in Browser with SnapAttack
In the site navigation, you can go to "Threats" → "Capture a New Threat" to capture a new threat in SnapAttack.
The first step in this process will be to select what machines we need. We choose a victim machine — the one which we will perform the attacks against, and optionally an attacker machine, if we need tools like metasploit or other frameworks. We can go ahead and "Start Capture".
In the background, the system is getting the VM ready for you. This is a fresh VM without any artifacts from past attacks or threat captures. You'll be able to access this machine directly from the browser. You can copy files, scripts, and tools into the VM, or make any changes necessary once the capture starts to replicate a threat.
After you're done launching the attacks, you can click "Save Capture".
You'll now prompted to give it a title, description, and optional tags. Once all of the information is in place, we can publish the threat to make it live in the system.
Subscription Feature
This feature is only available to subscribers and will be made available in August 2022.
Coming Soon
There's a lot of exciting improvements for threats on our roadmap. Here's a sneak peek at some of the upcoming features:
- Additional log sources and event types — we are constantly evaluating and adding additional log sources and event types to the platform. Focus areas include support for MacOS, cloud, and improved network capture. If you have suggestions, you can submit a feature request in the application.
- Attack Infrastructure — capturing threats can be hard if you don't have access to virtual machines or a non-production environment. As part of the Enterprise subscription, we'll provide the ability for users to spin-up virtual machines, create and deploy custom templates, and maintain images and persistent virtual machines.